
Your Truck Makes $87/Hour. Your Office Makes –$12.
Why Don't You Know This?
The busiest truck isn't the most profitable — and the crew that looks slow might be your best margin. A trades owner's guide to unit economics: contribution margin per truck, crew, and field hour, with real Montana numbers.

Ask most contractors which of their trucks makes the most money and they'll answer without hesitation: the busy one. The truck that's booked solid, running calls dawn to dark, the one they'd buy two more of if they could find the techs. It feels obvious. It's also, often, dead wrong.
Here's the uncomfortable truth: your average productive field hour probably throws off something like $87 in margin — and every hour your doors are open, the office quietly eats about $12 of it back. But that $87 is a blend, and the blend hides everything that matters. One truck might be making $112 an hour. Another, the one you swear is your workhorse, might be making $41. Same company, same logo on the door, nearly 3x difference in what they actually contribute. Most owners have no idea — because nobody ever taught them to look at the business one unit at a time.
This is unit economics, and it's the single most useful lens a trades business can adopt. It's not accounting theory — it's the difference between growing the truck that's quietly bleeding you and growing the one that's carrying the company. Let's break it down, with real numbers.
By Carrie Anderson — Co-Founder, 406 Consulting Group. Commercial banking and underwriting background — 300+ loan reviews — where the whole job was figuring out which businesses actually made money, and where.
The Short Version
- →Revenue lies. The busiest truck is often the least profitable — high activity, thin margin.
- →Measure per unit. Track contribution margin per truck, crew, and field hour — not just company-wide profit.
- →Load the real costs. Labor burden, truck cost per hour, fuel, callbacks — the ones owners forget.
- →Then act. Reprice, redeploy, or drop the work that's dragging you — and grow the unit that's winning.
- →You don't need a $15M company or a finance department to see this.
Table of Contents
The Argument You'd Have at the Bar
Let's make this concrete. Meet Bridger Mechanical, a plumbing and heating shop in Bozeman doing about $2M a year across three trucks. The owner, we'll call him Ryan, would tell you Truck 1 is the star. Dave runs it — emergency service calls, forty-five billable hours a week, always slammed. Truck 2 is the install crew doing system replacements; they run maybe thirty billable hours a week and Ryan half-jokes they're "taking their time."
If you asked Ryan at the bar which truck he'd clone, he'd say Truck 1 every time. More hours, more tickets, more revenue. It's the obvious answer, and it's the one almost every contractor gives. But "busy" and "profitable" are not the same word — and when we actually ran the numbers on Bridger, the busy truck and the slow truck traded places.

To see why, you have to stop looking at the company as one big number and start looking at it one truck at a time. That's the whole game.
Revenue Is a Vanity Metric
"We did two million this year." It feels great to say. It tells you almost nothing about whether you made money — and even less about where. Revenue is the number contractors brag about and bankers glance past, because a business can grow revenue every year and slowly go broke doing it. Two contractors can both hit $2M: one takes home $250K, the other takes home $40K and can't figure out why. The difference isn't how much they sold. It's the margin underneath each thing they sold.
For trades especially, revenue hides a brutal amount of variation. An emergency service call and a full system replacement both show up as "revenue," but one might carry a 12% margin after everything and the other 35%. Chase revenue and you'll happily fill your schedule with the 12% work because it keeps everyone busy — and wonder every December why busy didn't turn into money.

Revenue is the top of the funnel. Unit economics is what happens at the bottom — and the bottom is the only part that pays you.
What "Unit Economics" Means for a Contractor
"Unit economics" sounds like something a tech startup says. Strip the jargon and it's dead simple: pick the thing your business repeats, and figure out what one of them actually makes you. For a contractor, the "unit" is usually one of these:
| The unit | The question it answers |
|---|---|
| Per truck / crew | Which of my trucks actually makes money — and which just makes noise? |
| Per job type | Do service calls, installs, or maintenance contracts carry the margin? |
| Per field hour | What does one productive hour in the field really contribute? |
| Per customer / segment | Is that big loyal account a profit center or a polite charity? |
You don't need all of these at once. Start with one — for most trades, per truck or per field hour is the fastest gut-punch of clarity. The point is to stop asking "did we make money?" and start asking "which of these made money, and how much?"
The Number That Matters: Margin per Field Hour
Here's the one number to burn into your brain: contribution margin per field hour. It's the revenue a unit brings in, minus the costs that unit actually causes — labor, materials, fuel, truck wear, callbacks — divided by the productive hours it worked. It's not net profit (overhead comes later); it's what each unit contributes toward covering the office and paying you. Back to Bridger's two trucks:
| Per billable hour | Truck 1 — "the busy one" | Truck 2 — "the slow one" |
|---|---|---|
| Revenue billed | $150 | $185 |
| Tech labor (loaded) | –$52 | –$44 |
| Materials / parts | –$28 | –$14 |
| Truck + fuel + repairs | –$17 | –$9 |
| Callbacks / rework | –$12 | –$6 |
| Contribution / hour | ≈ $41 | ≈ $112 |

Look at that. Truck 1 bills less per hour, burns more parts on small jobs, drives an old van, and eats callbacks from a rushed junior tech — so it nets about $41 an hour. Truck 2 does bigger, cleaner replacement jobs with a better attach rate and a newer van — about $112 an hour. The "slow" truck contributes almost three times as much for every hour it works. Ryan had it exactly backwards.
Loading the Costs Owners Forget
The reason most contractors think Truck 1 is the winner is that they only count the obvious cost — what they pay the tech — and skip the rest. To get an honest number, you have to load in the costs each unit really causes:
The real labor burden, not the wage
A tech at $30/hr costs you closer to $42–$48 once you add payroll taxes, workers' comp, benefits, and paid non-billable time. Trades comp isn't cheap — use the loaded number.
Truck cost per hour
Payment or depreciation, insurance, fuel, maintenance, tires. An old van that's 'paid off' still costs real money per hour in repairs and downtime — often more than a newer one.
Callbacks and rework
The hours you go back and fix it for free are pure margin destroyers, and they cluster on specific crews and job types. Rushed service work generates far more than clean installs.
Materials waste and attach rate
Small jobs burn proportionally more parts, trips, and markup-free miscellany. Bigger jobs spread fixed effort over more revenue and add higher-margin add-ons.
Non-billable time
Drive time, shop time, waiting on parts. A truck 'booked' 45 hours may only bill 32. Your per-hour math has to use billable hours, not clock hours.
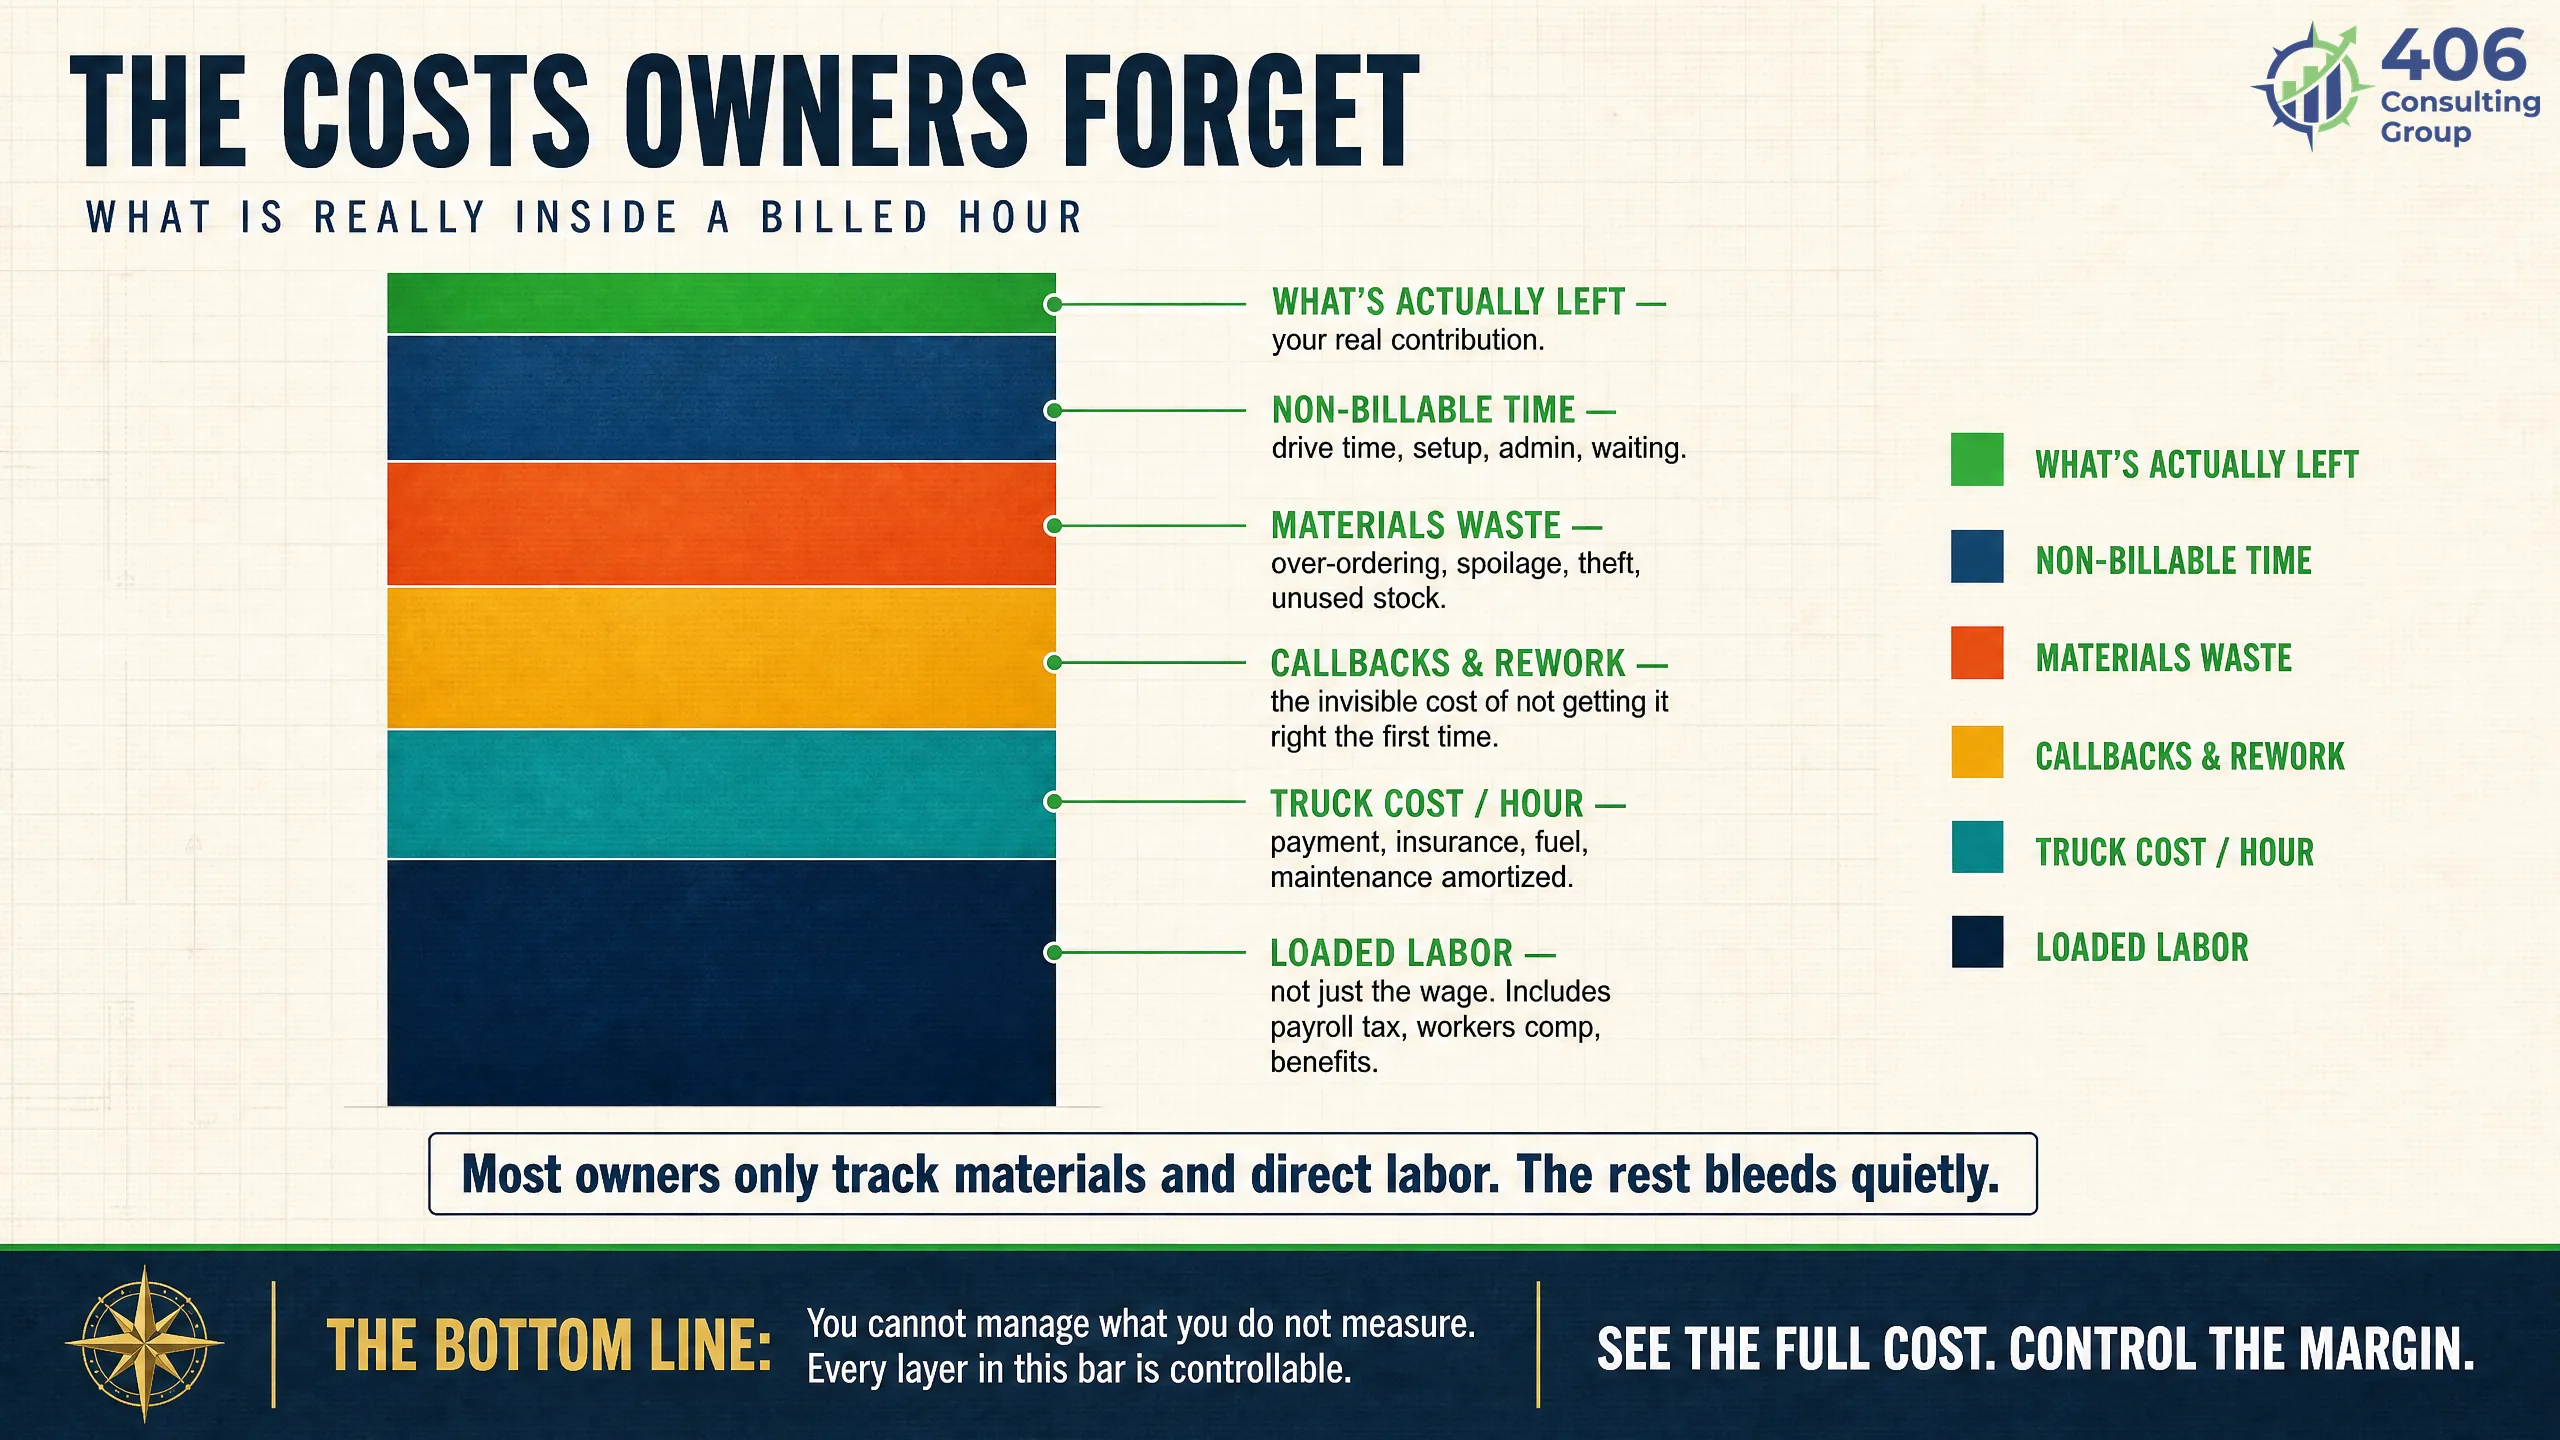
None of this is exotic. It's just the stuff that never makes it onto the invoice, so it never makes it into the owner's mental math — and it's exactly where the busy truck quietly loses the race.
The –$12 Office
There's one more unit nobody thinks of as a unit: the office. Rent, the dispatcher, software, insurance, the bookkeeper, and — usually — the owner doing quotes and returning calls at 9pm. None of it touches a wrench, but all of it has to be paid, and the only place the money comes from is the field. Spread that overhead across the hours your trucks actually bill, and it lands somewhere around $12 per field hour at a shop like Bridger.
That's not a criticism of overhead — you need an office. It's a benchmark. It means every field hour has to clear $12 just to break even on the building before it contributes a dime to you. Truck 2 at $112 clears it easily. Truck 1 at $41 still clears it — but there's a lot less left, and if its margin slips even a little, it's working to keep the lights on and nothing more. The office is the hurdle every truck has to jump; unit economics tells you which trucks are barely clearing it.

Knowing your office costs $12 an hour also keeps you honest about growth: adding overhead (a second dispatcher, a bigger shop) raises the hurdle for every truck. Worth it if it lets your good trucks run more billable hours; a quiet killer if it just raises the bar the weak ones already struggle to clear.
The Four Things This Reveals
Once you run the numbers per unit, the same handful of surprises show up in almost every trades business:
The busy-but-broke truck
High activity, thin margin. It feels essential because it's always moving — but it's running to stand still, and cloning it would multiply the problem.
The slow-but-rich crew
Fewer tickets, fatter margin. The crew you thought was 'taking their time' is quietly carrying the company. This is the one to feed.
The unprofitable 'good' customer
The big loyal account you'd never fire — with the discount, the slow pay, and the constant call-backs — is often a break-even or losing unit dressed up as a trophy.
The loss-leader service line
A whole category (say, cheap service calls, or a warranty program) that you keep 'because customers expect it' may be subsidized by everything else you do.
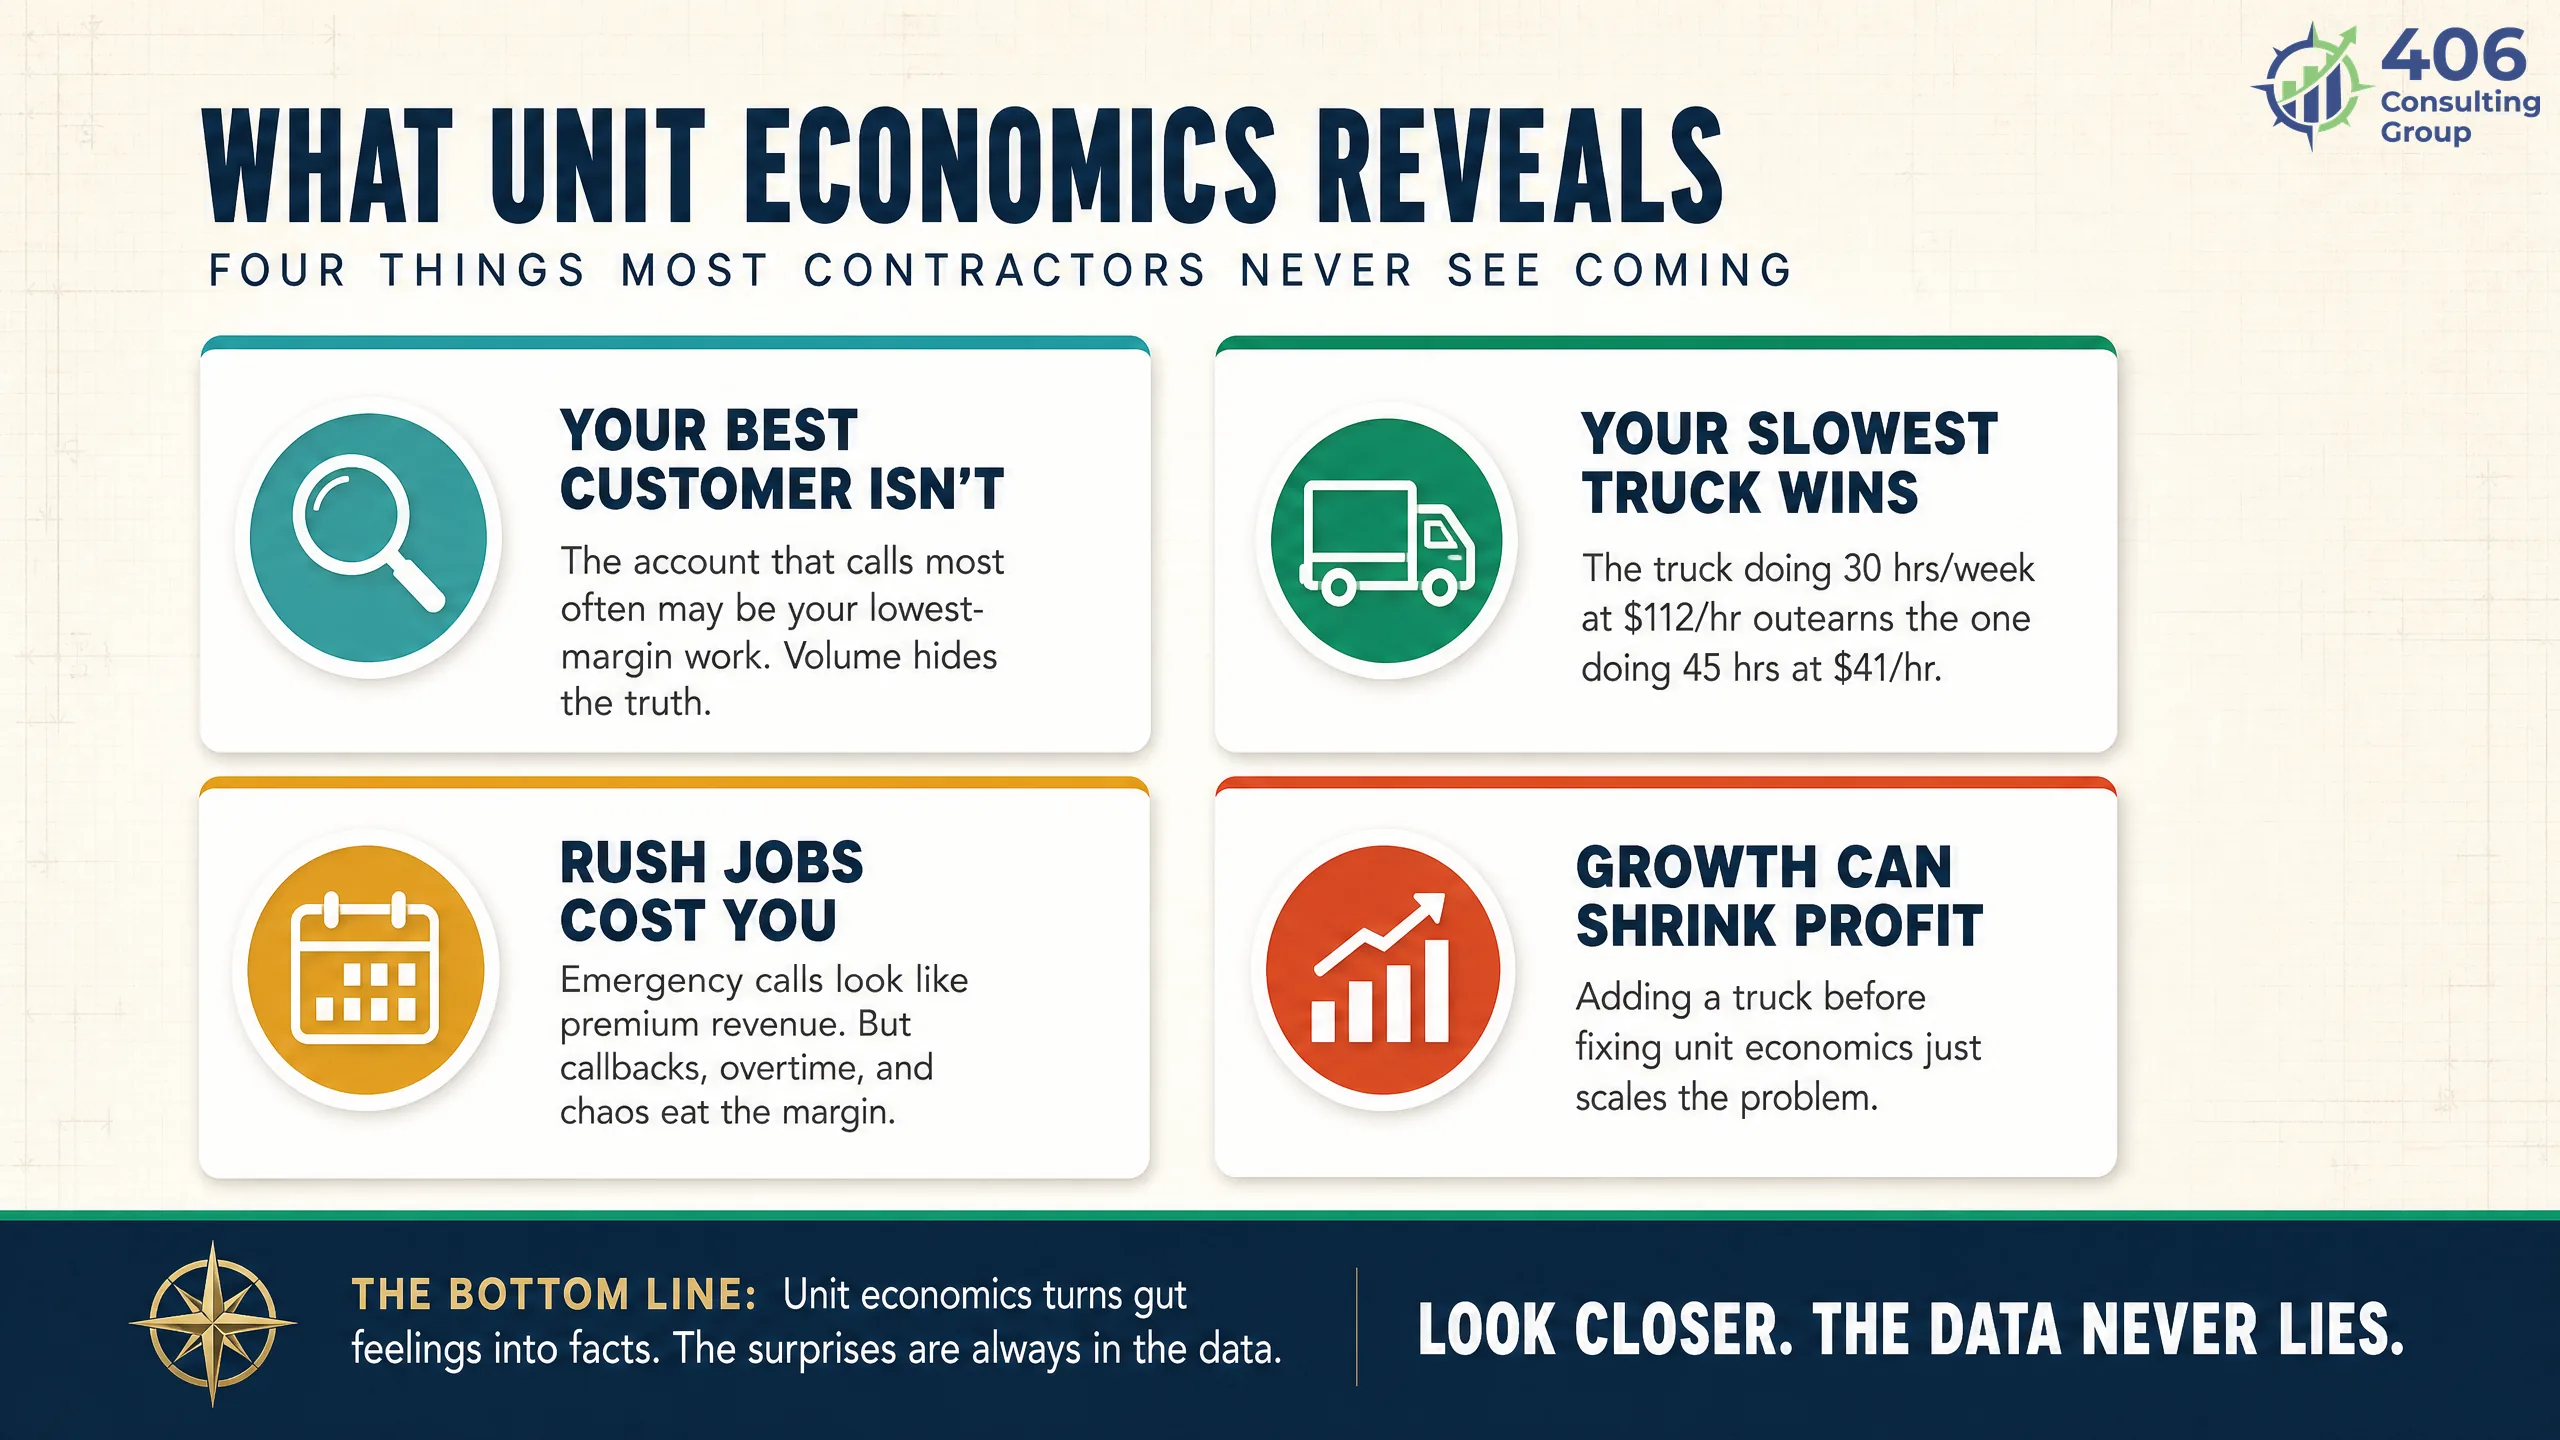
None of these are visible in a company-wide P&L. They only appear when you split the business into units and look at each one's margin. That's the whole reason to do this.
What to Do With It
Seeing the numbers is useless if you don't act on them. The good news: unit economics points straight at the decision. For any weak unit, you've got four honest options — and "fire the people" usually isn't one of them.
| Move | When to use it |
|---|---|
| Reprice | The work is fine, the price is wrong. Raise rates or restructure the quote until the margin clears the hurdle. |
| Redeploy | The people are good, the work is bad. Move that crew from thin service work to the high-margin jobs that are winning. |
| Fix the leak | Margin's lost to callbacks, waste, or slow billing. Fix the process — training, better vans, tighter estimating — not the headcount. |
| Drop the work | It can't be repriced and can't be fixed. Stop selling that job type or fire that customer — politely — and free the capacity for better work. |
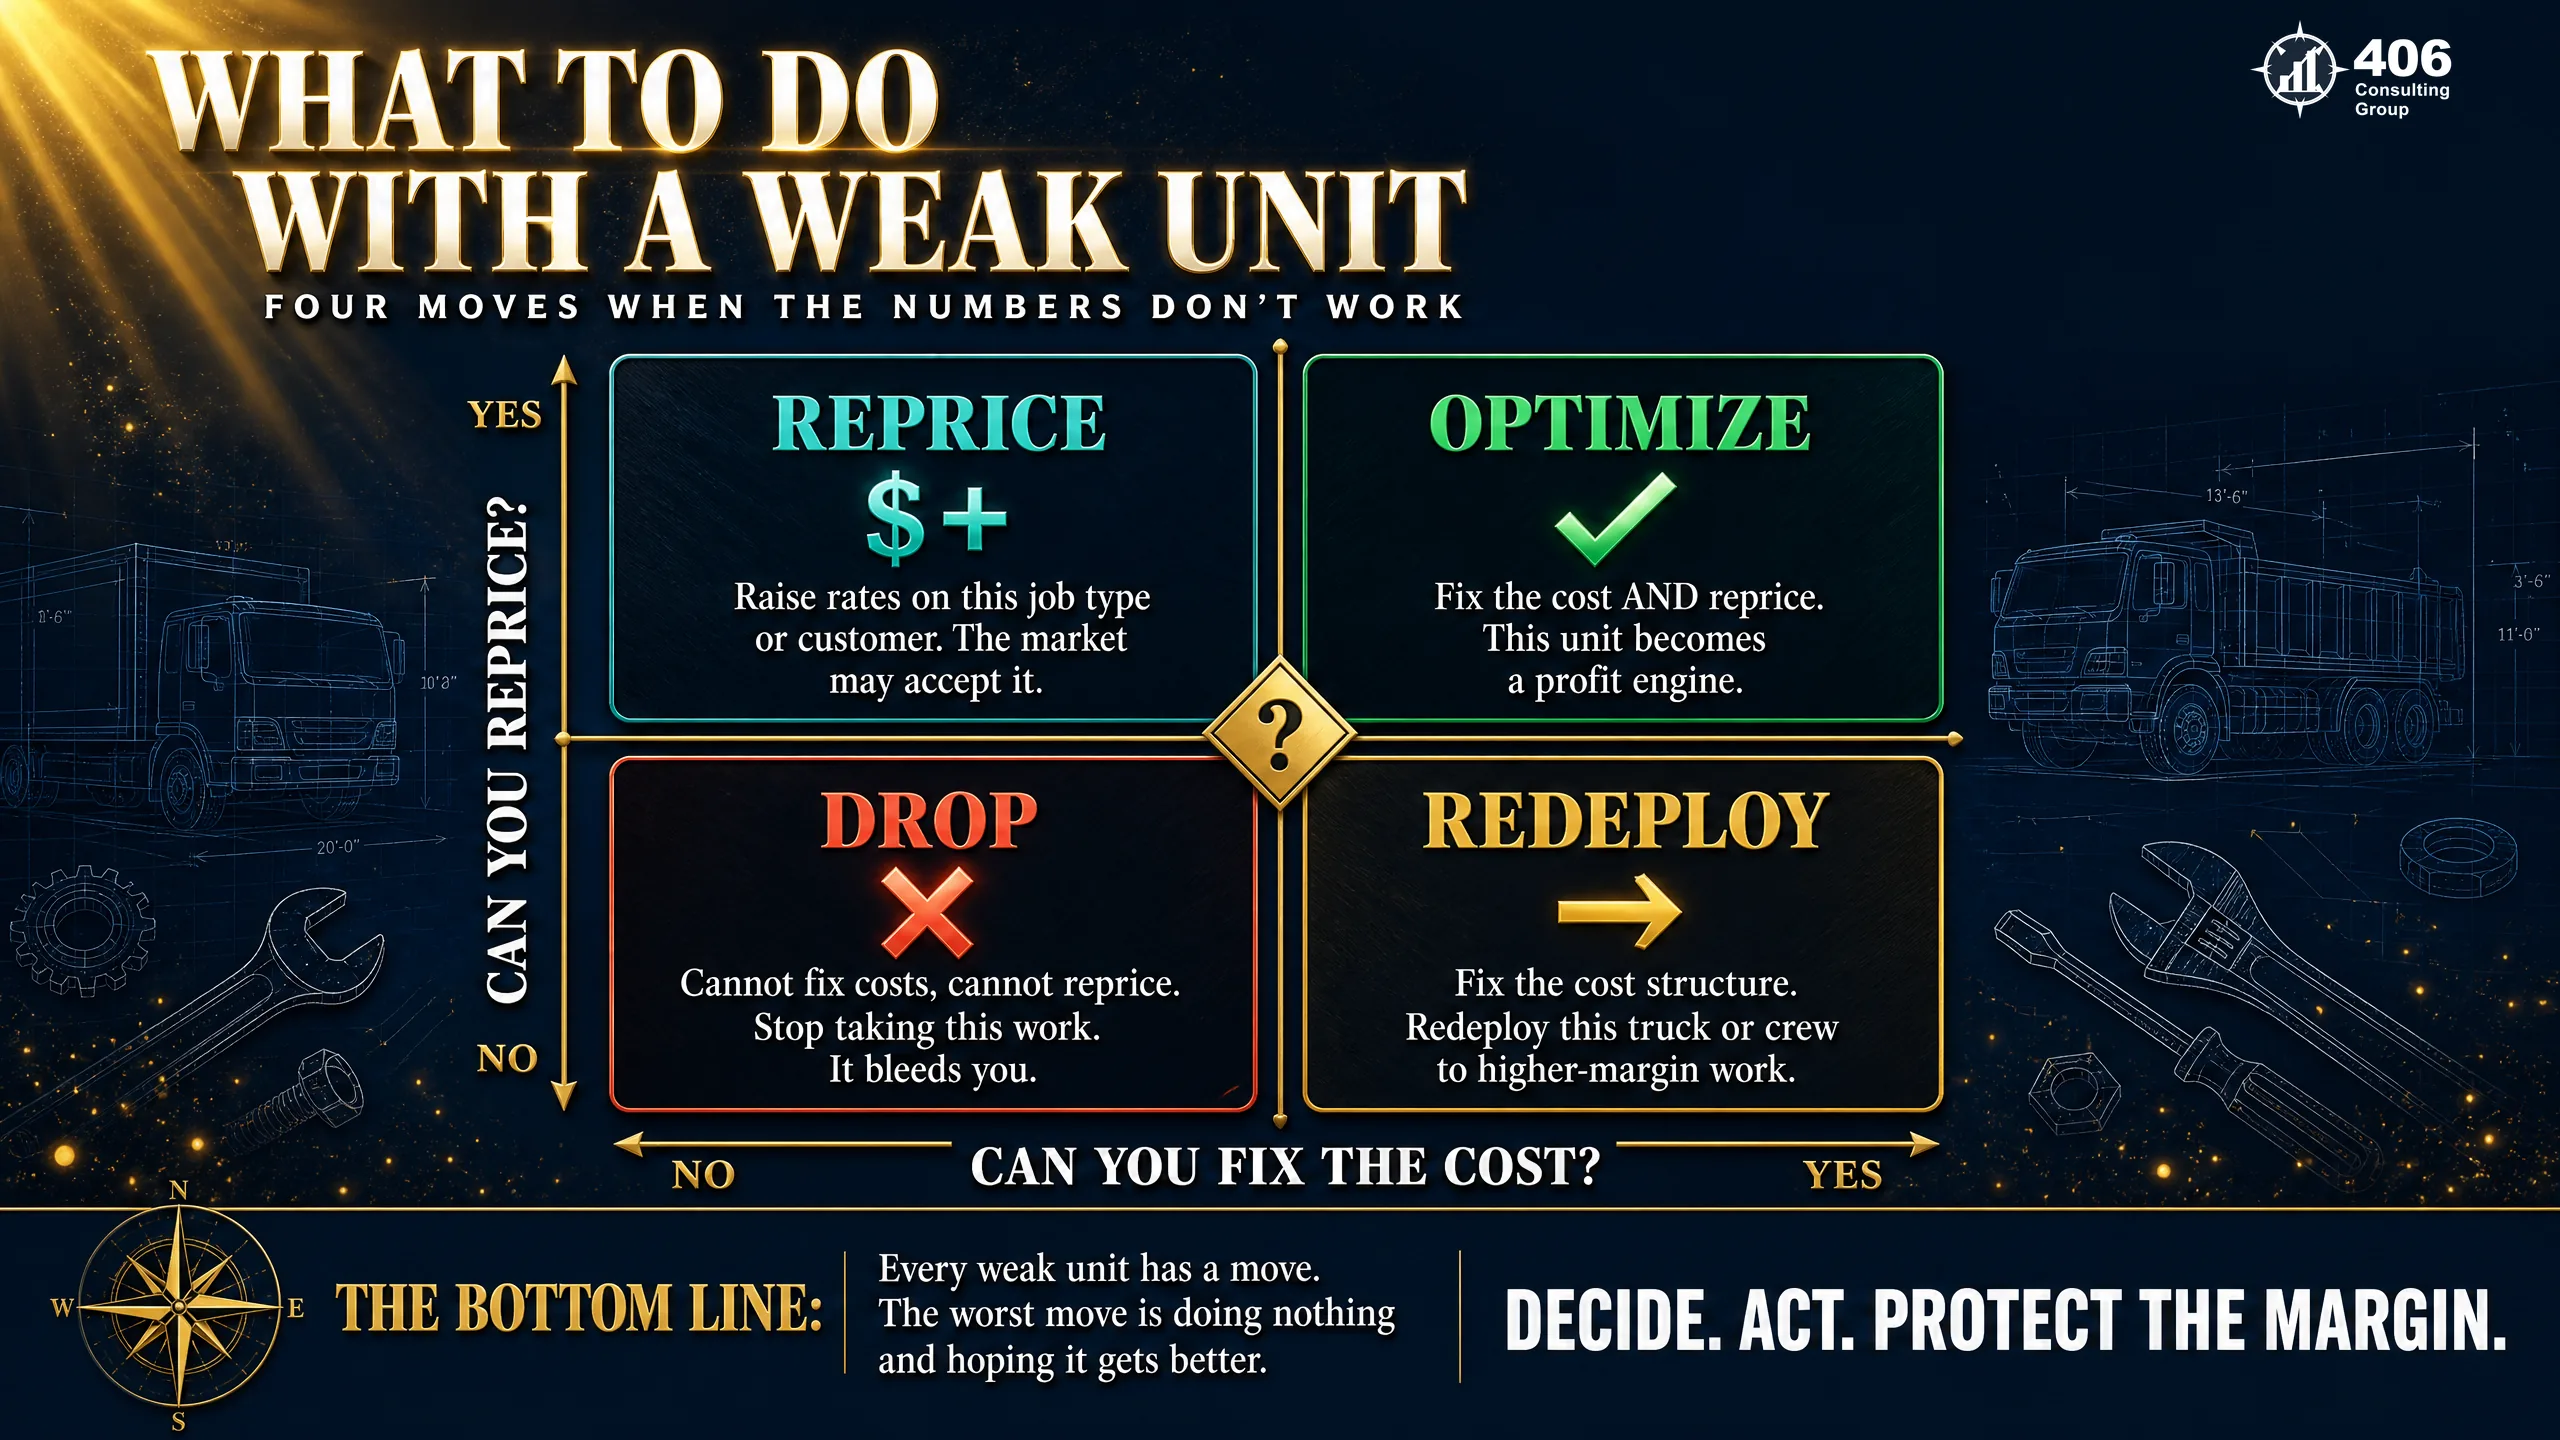
For Ryan, the answer wasn't firing Dave — it was retraining him, moving Truck 1 upmarket toward replacements, raising the service-call minimum, and putting the next new hire on the install side that was actually making money. Same three trucks, a very different bottom line a year later.
How to Actually See This Every Month
Here's the part where most owners check out: "great idea, but I'm not doing a research project every month." Fair. The trick is that you don't calculate unit economics by hand — you build it into the books once, and then it just falls out every month. That means setting up your accounting to tag revenue and direct costs by unit: class or location tracking for each truck or crew, job costing that captures labor and materials by job, and a clean split between direct costs and overhead.
This is exactly why we argue that accounting should be designed around how the business actually runs, not just around filing a tax return. A generic chart of accounts gives you one company-wide P&L and hides every insight in this article. A system built for a trades business gives you margin per truck, per job type, and per hour — automatically, every month — so the answer to "which truck should I clone?" stops being a bar argument and starts being a number.
A couple of our tools get you started fast: the Cost-Per-Mile calculator nails the true cost of running a truck, and the Break-Even Calculator shows the revenue each unit has to clear. Building the ongoing system is what our business systems and bookkeeping work is for.
You Don't Need a Finance Department
The instinct is that this is big-company stuff — that you need a controller and a fancy system to think this way. You don't. A three-truck shop can run unit economics on a well-built QuickBooks file and a simple monthly review. What you need isn't scale; it's the setup and someone to read the numbers with you a few times until it clicks.
That's the whole idea behind fractional financial help: you get the controller-and-CFO thinking — margin per unit, pricing, where to grow — without a six-figure hire, and you get it remotely. Most of our own clients never set foot in our office; the work runs on shared screens and clean cloud books. A contractor doing $800K can absolutely have this. In fact, that's exactly the size where knowing which truck makes money is the difference between the next hire growing your profit and quietly shrinking it.
If you're not sure where you stand, our Financial Maturity Assessment is a fast read on what your numbers can and can't yet tell you.
The Takeaway
You can't manage what you refuse to measure — and "we did two million" isn't a measurement, it's a headline. The contractors who pull away from the pack aren't the ones with the most trucks or the busiest schedule. They're the ones who know, to the dollar, what each truck, crew, and job type contributes — and who point their growth at the winners instead of the noise.
You don't have to boil the ocean. Start with one unit. Pick your busiest truck, load in the real costs, and figure out what it makes per billable hour. Then do the one you think is slow. If they trade places — and they often do — you've just found the most valuable number in your business. And it was hiding in plain sight the whole time.
The related read: the true cost of letting an amateur run your books — because none of this shows up if the numbers underneath aren't clean.
FAQ
What exactly is 'contribution margin per field hour'?
It's the revenue a unit brings in minus the costs that unit directly causes — loaded labor, materials, fuel, truck operating cost, callbacks — divided by the hours it actually billed. It's not net profit, because it doesn't yet subtract overhead (the office). It tells you what each truck or crew contributes toward covering that overhead and paying you. Comparing it across trucks, crews, or job types is how you find out which parts of the business actually make money.
Isn't my busiest truck obviously my most profitable?
Often, no — and that's the whole point. A busy truck can be busy precisely because it does cheap, fast, high-volume work with thin margins, a rushed tech who generates callbacks, and an old van that eats fuel and repairs. A 'slower' truck doing larger, cleaner jobs can contribute two to three times as much per hour. You can't tell which is which from revenue or from how full the schedule looks; you can only tell by loading the real costs onto each unit and comparing margin per hour.
How do I figure out what my overhead costs per field hour?
Add up your true overhead for a period — rent, office staff, software, insurance, admin, owner's non-field time — then divide by the number of hours your trucks actually billed in that same period. If overhead is $180K a year and your crews bill 15,000 hours, that's about $12 per field hour. Every billable hour has to clear that number before it contributes a dime to profit. It's a benchmark that also keeps you honest about adding overhead, since new overhead raises the hurdle for every truck.
Do I need special software or a controller to do this?
No. A three-truck shop can run unit economics on a well-structured QuickBooks file using class or location tracking for each truck and basic job costing — plus a monthly review with someone who knows how to read it. The heavy lift is the one-time setup so the numbers fall out automatically each month, not a manual project every time. Many trades businesses get there with fractional, remote help rather than a full-time finance hire.
What if the numbers say a loyal customer or a whole service line loses money?
First, make sure the costs are loaded correctly — then take it seriously. You usually have four options: reprice it so the margin works, redeploy your good people to better work, fix the process leak (callbacks, waste, slow billing) that's killing the margin, or drop the work and free that capacity for something profitable. Firing people is rarely the right answer; the problem is almost always the pricing or the process, not the crew. Unit economics just makes the choice obvious instead of emotional.
Keep Reading
Growth & Advisory
Find Out Which Truck Actually Makes You Money.
406 Consulting Group builds trades businesses the kind of books that show margin per truck, crew, and job — and helps you act on it. Remote, and built by people who think about the whole operation, not just the tax return.
The One-Truck Test
Start here this week
Which Truck Makes Money?
We'll build books that tell you.
About the Author
Carrie Anderson
Co-Founder, 406 Consulting Group
Commercial banking and underwriting background — 300+ loan reviews — where the whole job was figuring out which businesses made money, and where. Carrie helps Montana trades and contractors see the margin hiding inside their revenue.
Read the Full Story