
The CFO Services Scorecard:
How We Measure Financial Health
Most businesses over $1M lose money they can't see. Our 84-point CFO Services Scorecard reveals the exact financial leaks — and the department imbalances blocking growth — before they become a crisis.
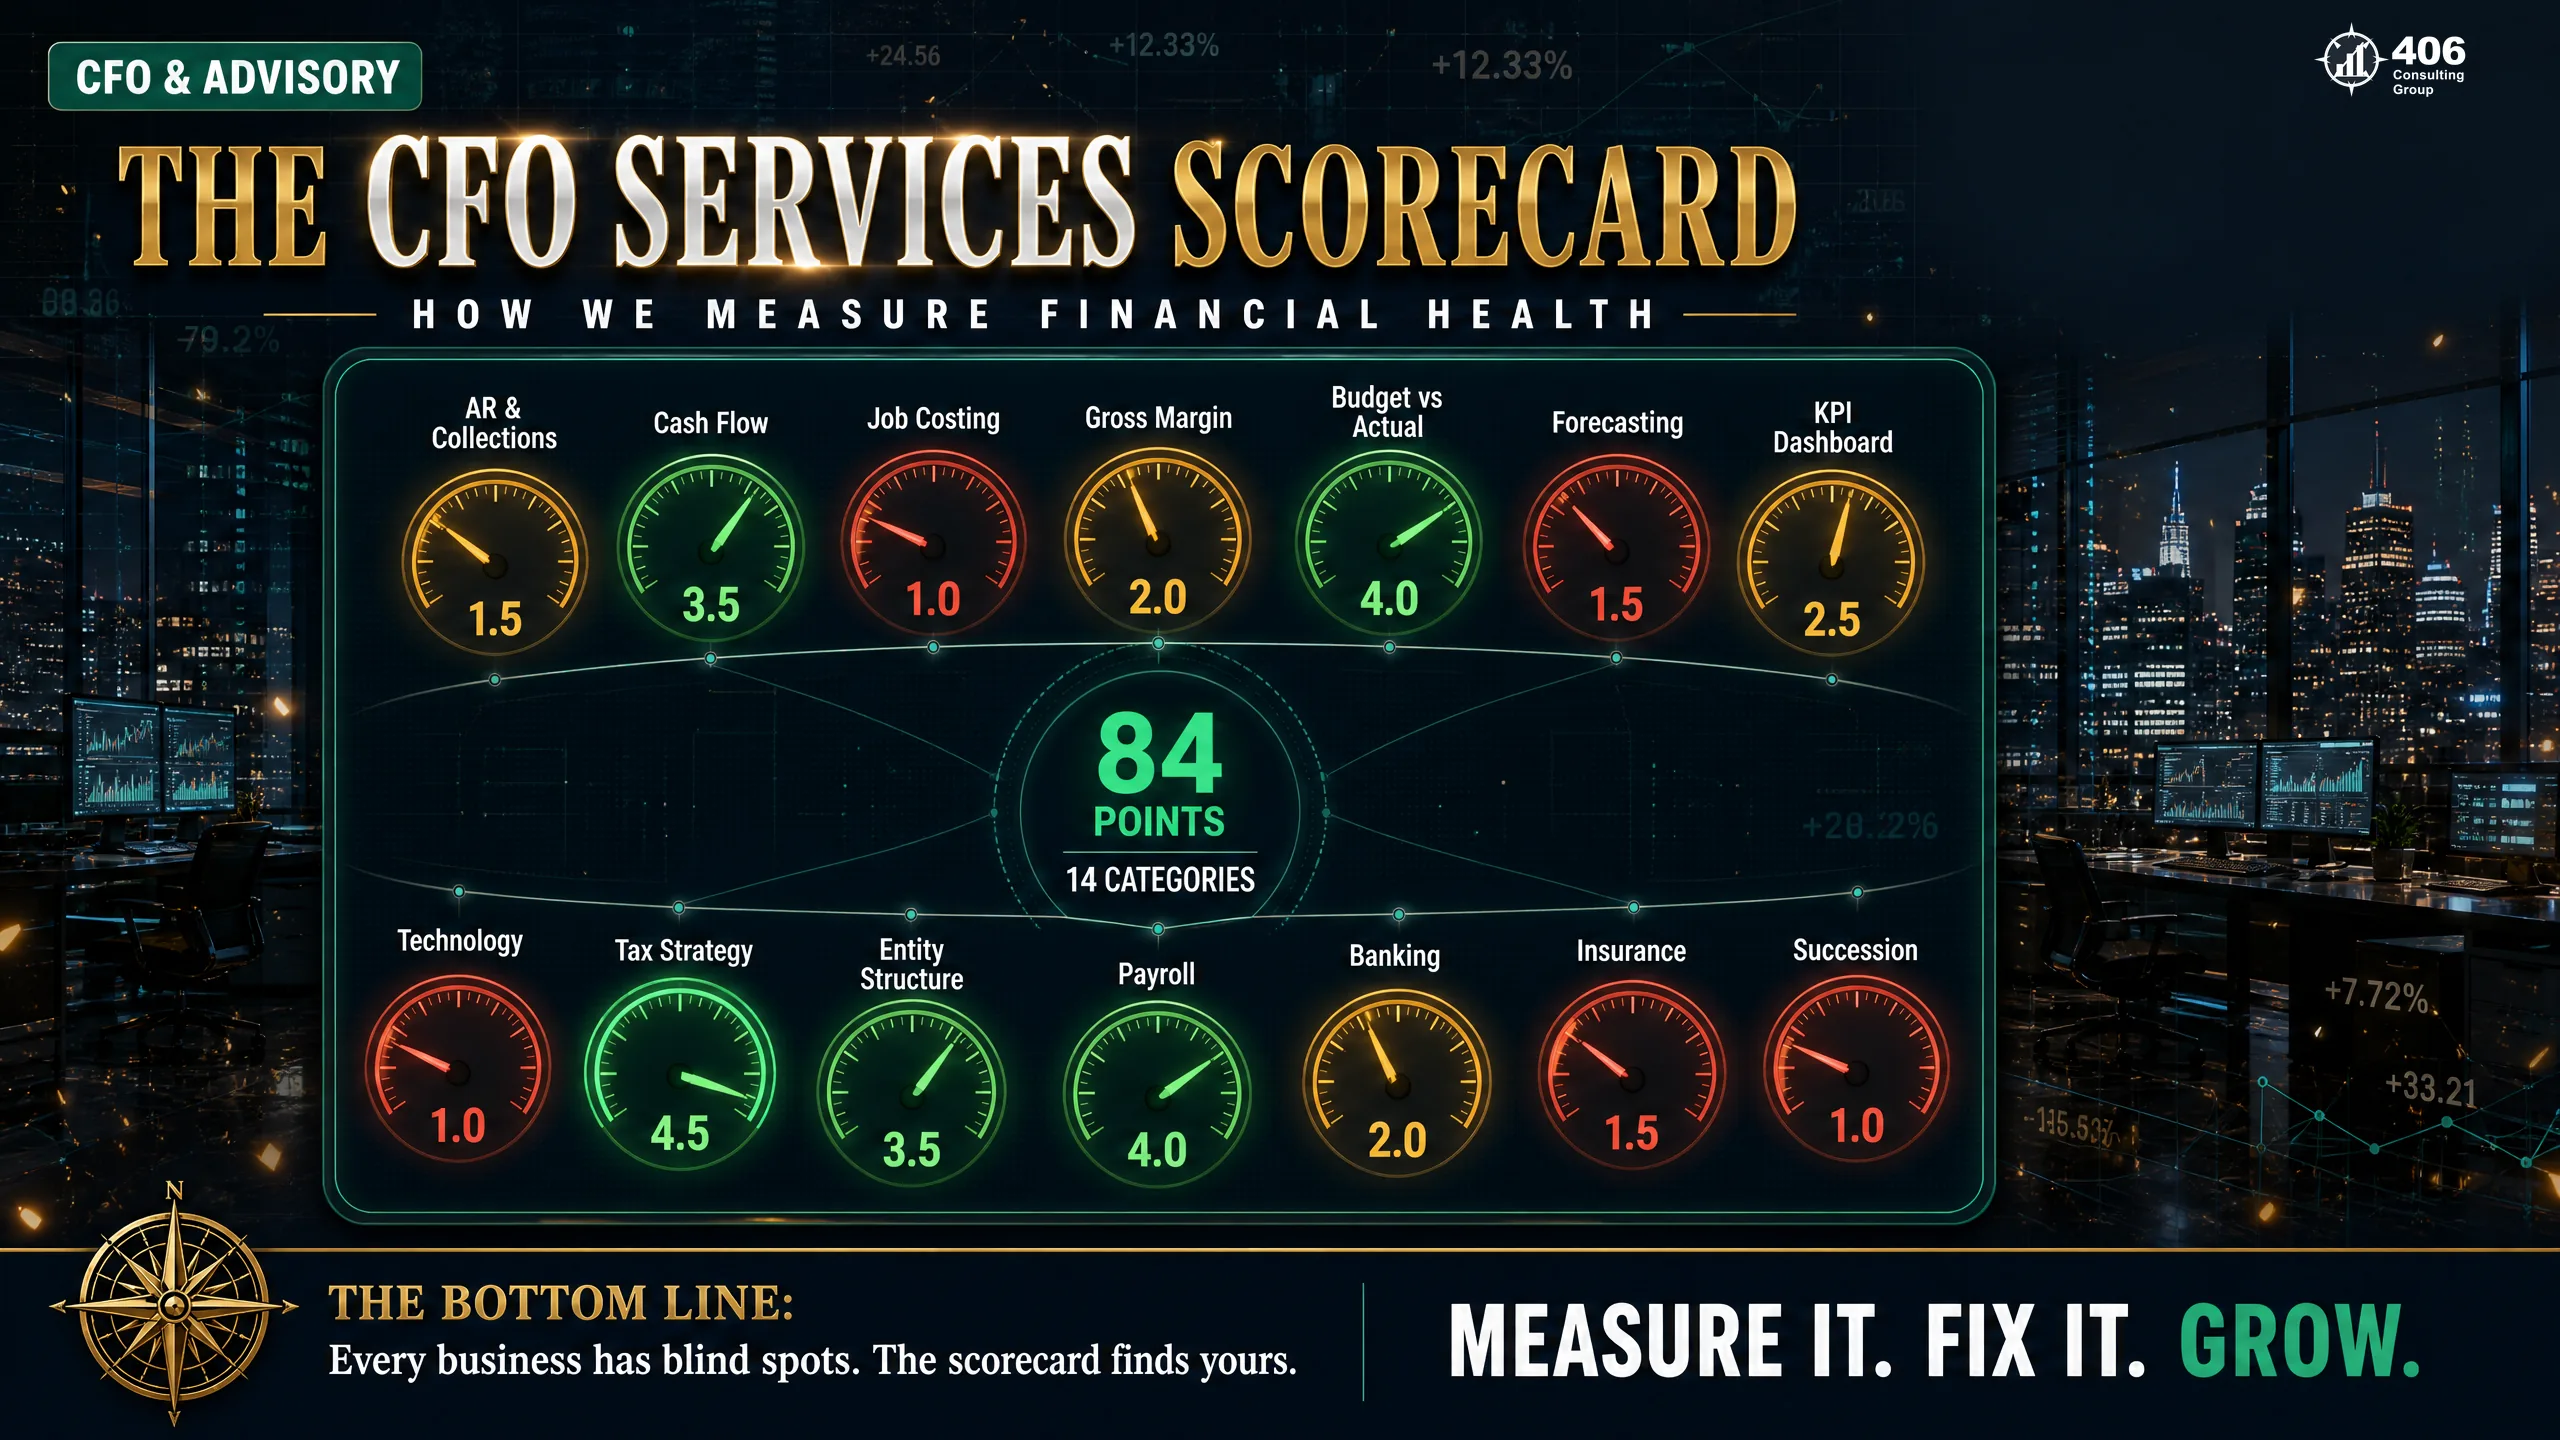
Every consulting firm has a playbook. Most will sell you the idea that the right framework, applied with enough conviction, can transform your business. What they won't tell you is that a playbook only works if your business is ready to receive it — and most businesses aren't.
The CFO Services Scorecard is our answer to that problem. It's an 84-point diagnostic across 14 categories of financial health — designed not to sell you a transformation, but to tell you exactly where your business stands, what it's costing you, and what to fix first. No fantasy. No playbook. Measurement.
Table of Contents
The Fantasy They're Selling You
Walk into any consulting engagement and within thirty minutes someone will show you a slide with a growth curve on it. Revenue doubles. Profit triples. The business runs without you. There's a framework for it — usually named something that makes a memorable acronym — and if you implement the framework, the curve is supposed to happen.
Here is what that conversation almost never includes: a rigorous, honest assessment of whether your business is actually capable of executing that framework right now. Because most aren't. Not because the owner isn't capable or hasn't tried hard enough. But because the financial infrastructure — the systems, processes, reporting, and controls that make scaling possible — isn't there yet.
Growth amplifies whatever is already present. A broken accounts receivable process at $1M in revenue becomes a cash flow crisis at $3M. Contracts priced on instinct at $800K become a $120,000-per-year margin leak at $2.5M. Manual data entry that takes one person a day at $1.5M takes three people two days at $4M. The business grew. The problems scaled with it.
84 Points
Total assessment criteria
Scored 0–5 across 14 categories. Produces a Financial Maturity Score that drives every recommendation.
14 Categories
Dimensions of financial health
From bookkeeping infrastructure to exit readiness — every function that determines whether a business can scale.
$227K
Leaks found in one engagement
Valley Green Scapes — $4.2M landscaping company. Three categories. Six months to +$107,000 net profit.
Why 406 Built a Scorecard Instead of a Playbook
Jason Anderson spent a decade at BP — an environment where a bad decision cost millions and every system was measured. When he and Carrie Anderson founded 406 Consulting Group, they brought that same insistence on measurement to small business advisory. The Scorecard is not a product. It's how we think. Before any recommendation gets made, we want to know exactly where the business stands across all 14 dimensions — because that's the only way to know what to fix first.
The Hidden Problem: Uneven Financial Maturity
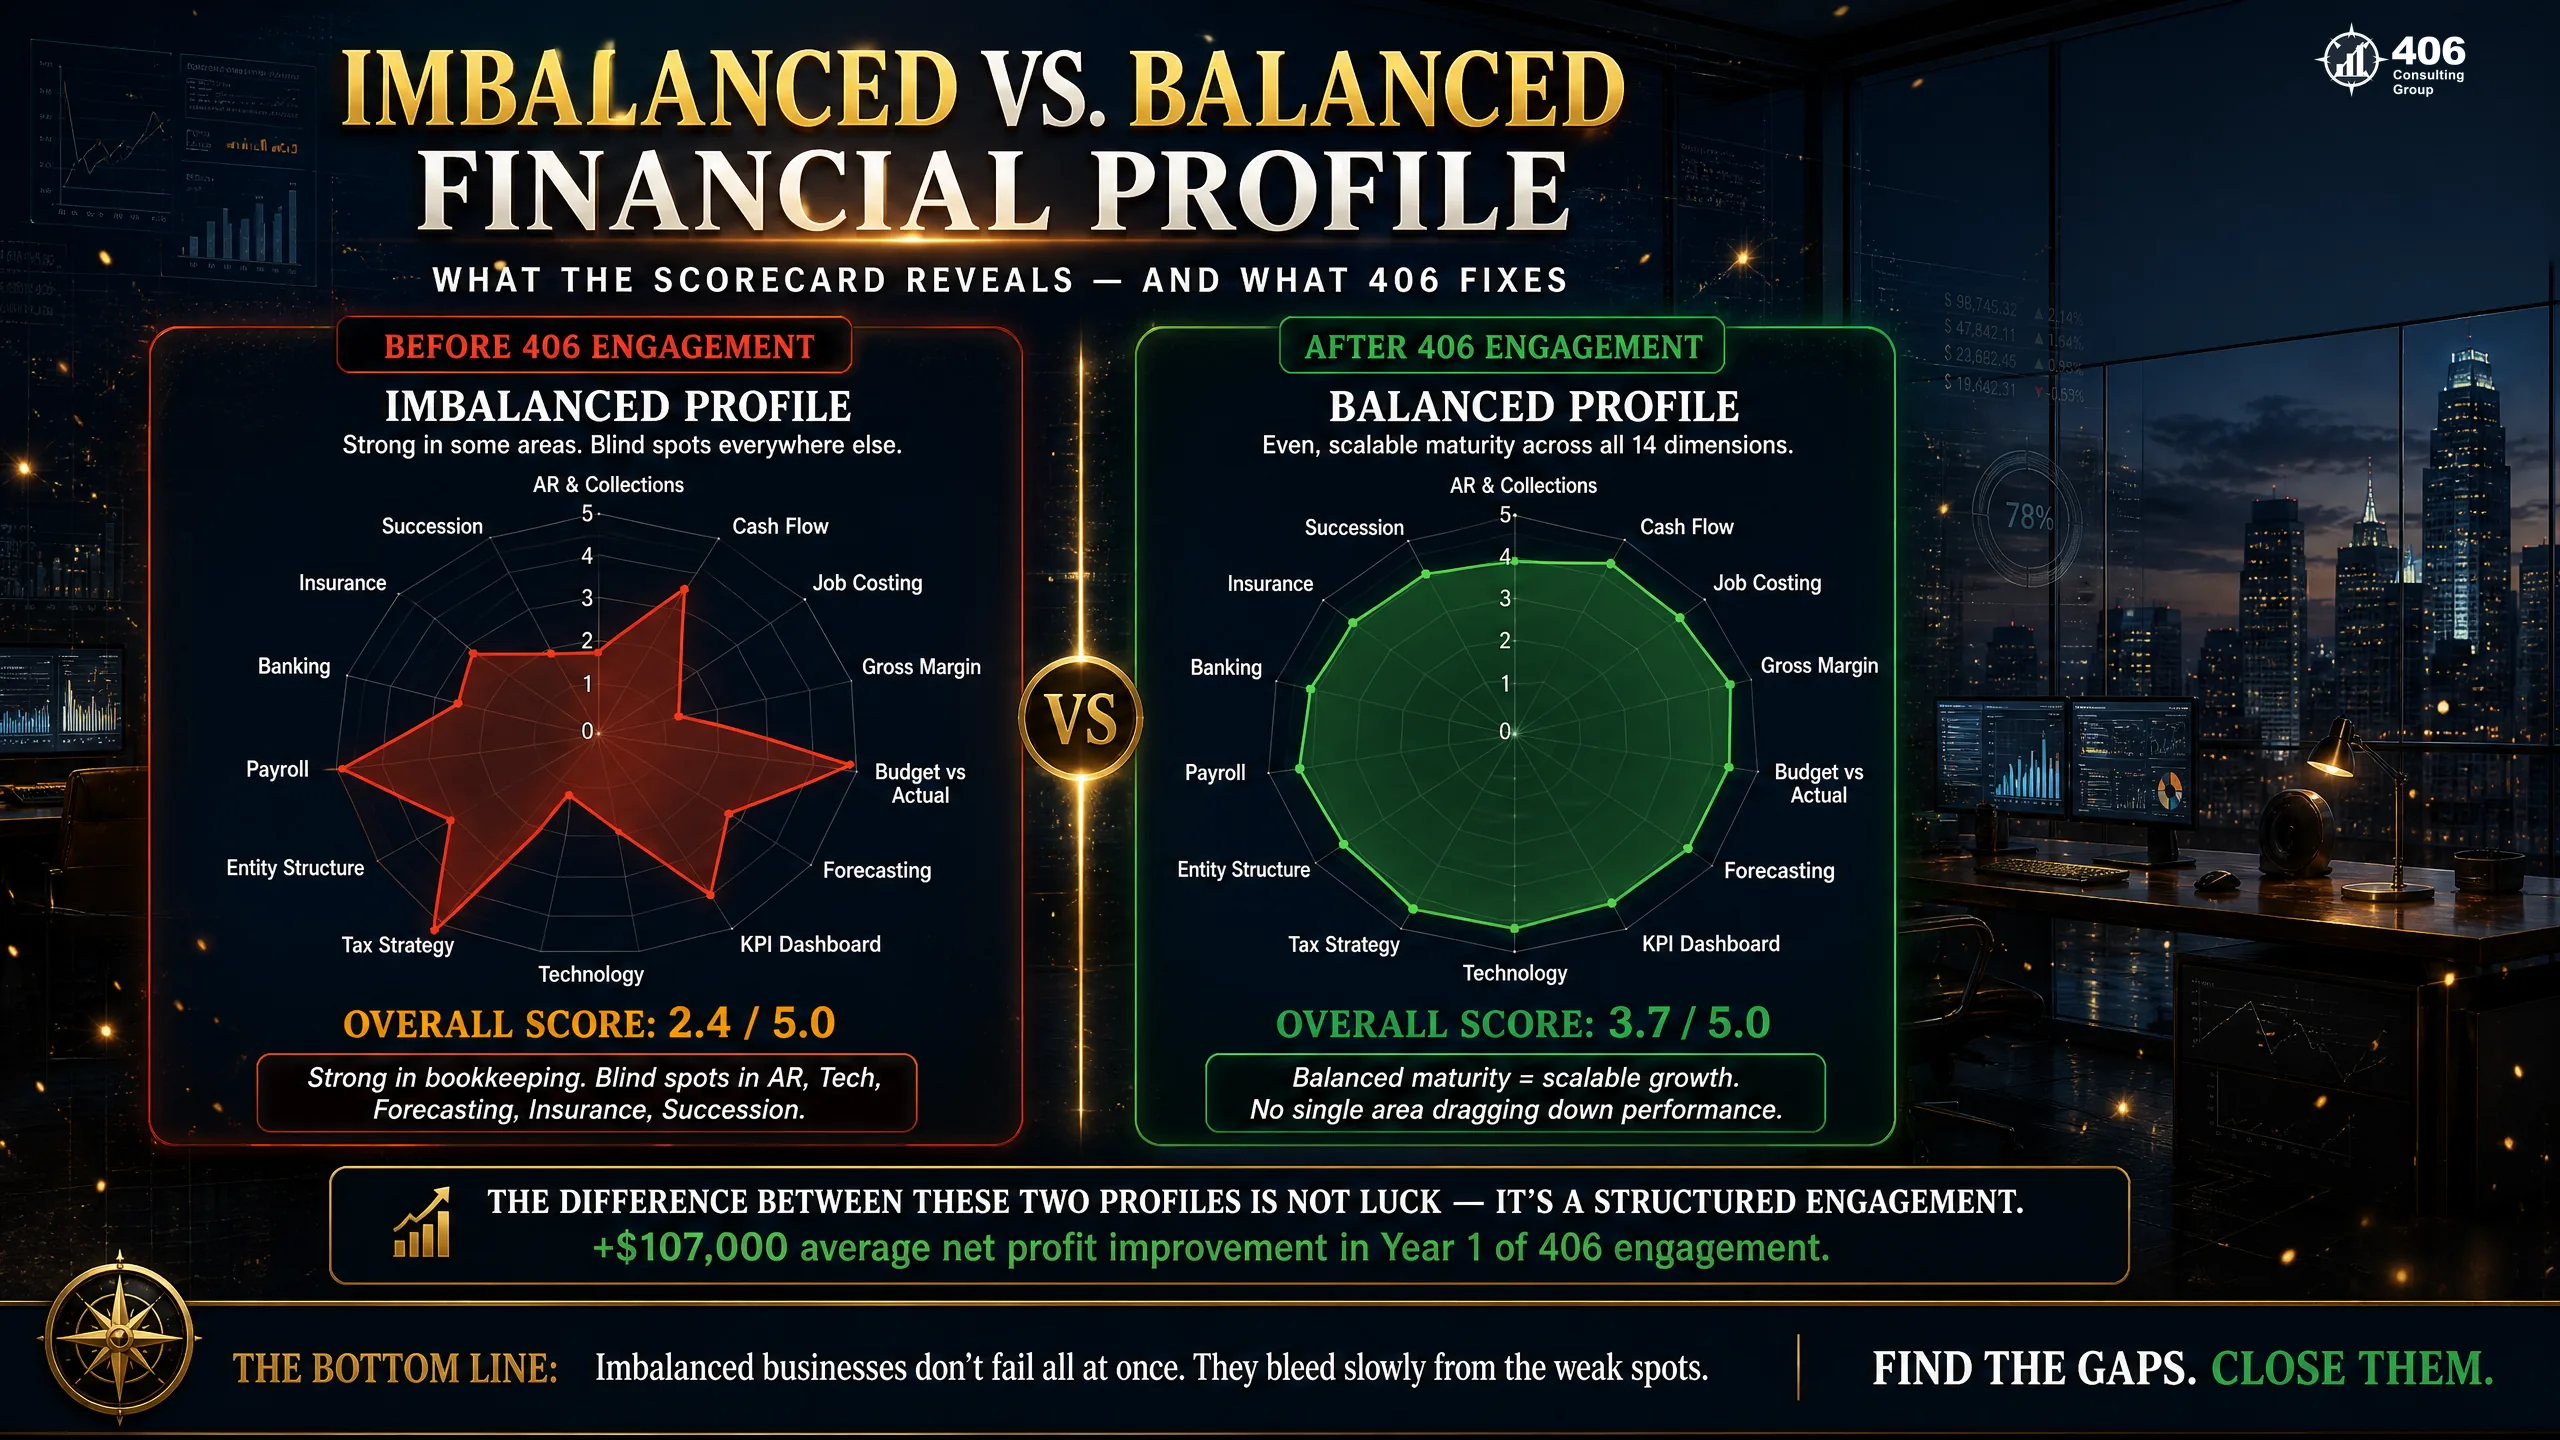
Most businesses don't fail because they're weak everywhere. They fail — or plateau — because they're uneven. Strong in one or two areas and dangerously underdeveloped in others. And when they try to scale, the weakest department determines the ceiling.
Think about what that looks like in practice. A Montana construction company has excellent accounting infrastructure — clean books, accurate records, timely month-end close. Score: 4.5 out of 5. They can tell you exactly what the bank account balance is. But their Gross Margin and Job Costing score is 1.0 — no job costing at all, contracts priced off instinct. Their Technology and Automation score is 1.2 — admin staff manually re-entering data between three different systems. Their Cash Flow Forecasting score is 1.5 — no forecast, no budget, decisions made by checking the balance.
What does this business look like from the outside? Revenue is growing. The owner is working hard. The books are clean. But profit is shrinking. Cash flow is unpredictable. The owner can't explain why some jobs seem profitable and others feel like a grind. Clean books don't save you if the decision-making layer above them doesn't exist.
The Core Insight Behind the Scorecard
The goal of the 406 CFO Services Scorecard is not to make every category a 5. That's not realistic, and it's not the goal. The goal is to bring all 14 categories close enough to the same level that you can grow without one of them collapsing under the weight of scale. A balanced score profile at 3.2 across all 14 categories will outperform an unbalanced profile that averages 3.5 — because the low outliers in the unbalanced profile are where growth breaks down. Find the gaps. Close them. Then scale.
Why “Gut Feel” Stops Working at $1 Million
Under $500,000 in revenue, most business owners can track the financial health of their business mentally. They know who owes them money. They remember what the big jobs cost. They have a feel for whether payroll will clear. The business is small enough that intuition works — imperfectly, but workably.
Revenue growth changes that. Not all at once, and not on a predictable schedule — but at specific inflection points, the complexity of running on instinct crosses the cost of the mistakes that instinct produces.
$1M
revenue
Cash Flow Complexity Outpaces Awareness
A 30-day delay in receivables can create a payroll crisis even in a profitable month. Vendors are on payment terms. Clients are on net-30 or net-45. The gap between revenue earned and cash received is real, and mental tracking doesn't catch it until the account is low.
$3M
revenue
Margin Erosion Becomes Invisible
Without job costing, you're averaging margin across all jobs, all clients, all service lines. That average hides the jobs losing money and the jobs carrying everyone else. At $3M, a 3% margin bleed you can't see is $90,000 per year leaving quietly.
$5M
revenue
Structural Risk Compounds
Wrong entity structure, wrong debt terms, inadequate internal controls — each of these was a small problem at $1M. At $5M, they're material exposures. An employee fraud event at this scale averages $150,000 per incident. A poorly structured entity costs $20,000+ per year in excess SE tax while the business earns enough to make it matter.
The Operational Standard That Shapes How We Work
Jason Anderson's career at BP was built in an environment where gut feel wasn't an option — not when managing one million barrels of petroleum every five days through high-stakes pipeline operations. Every decision had a measurement behind it, and every measurement was held to account. That operational discipline — the insistence on knowing before deciding — is what 406 brings to every client engagement. If you can't measure it, you can't manage it. And if you can't manage it, you can't scale it.
How the Scorecard Works: The 0–5 Financial Maturity Scale
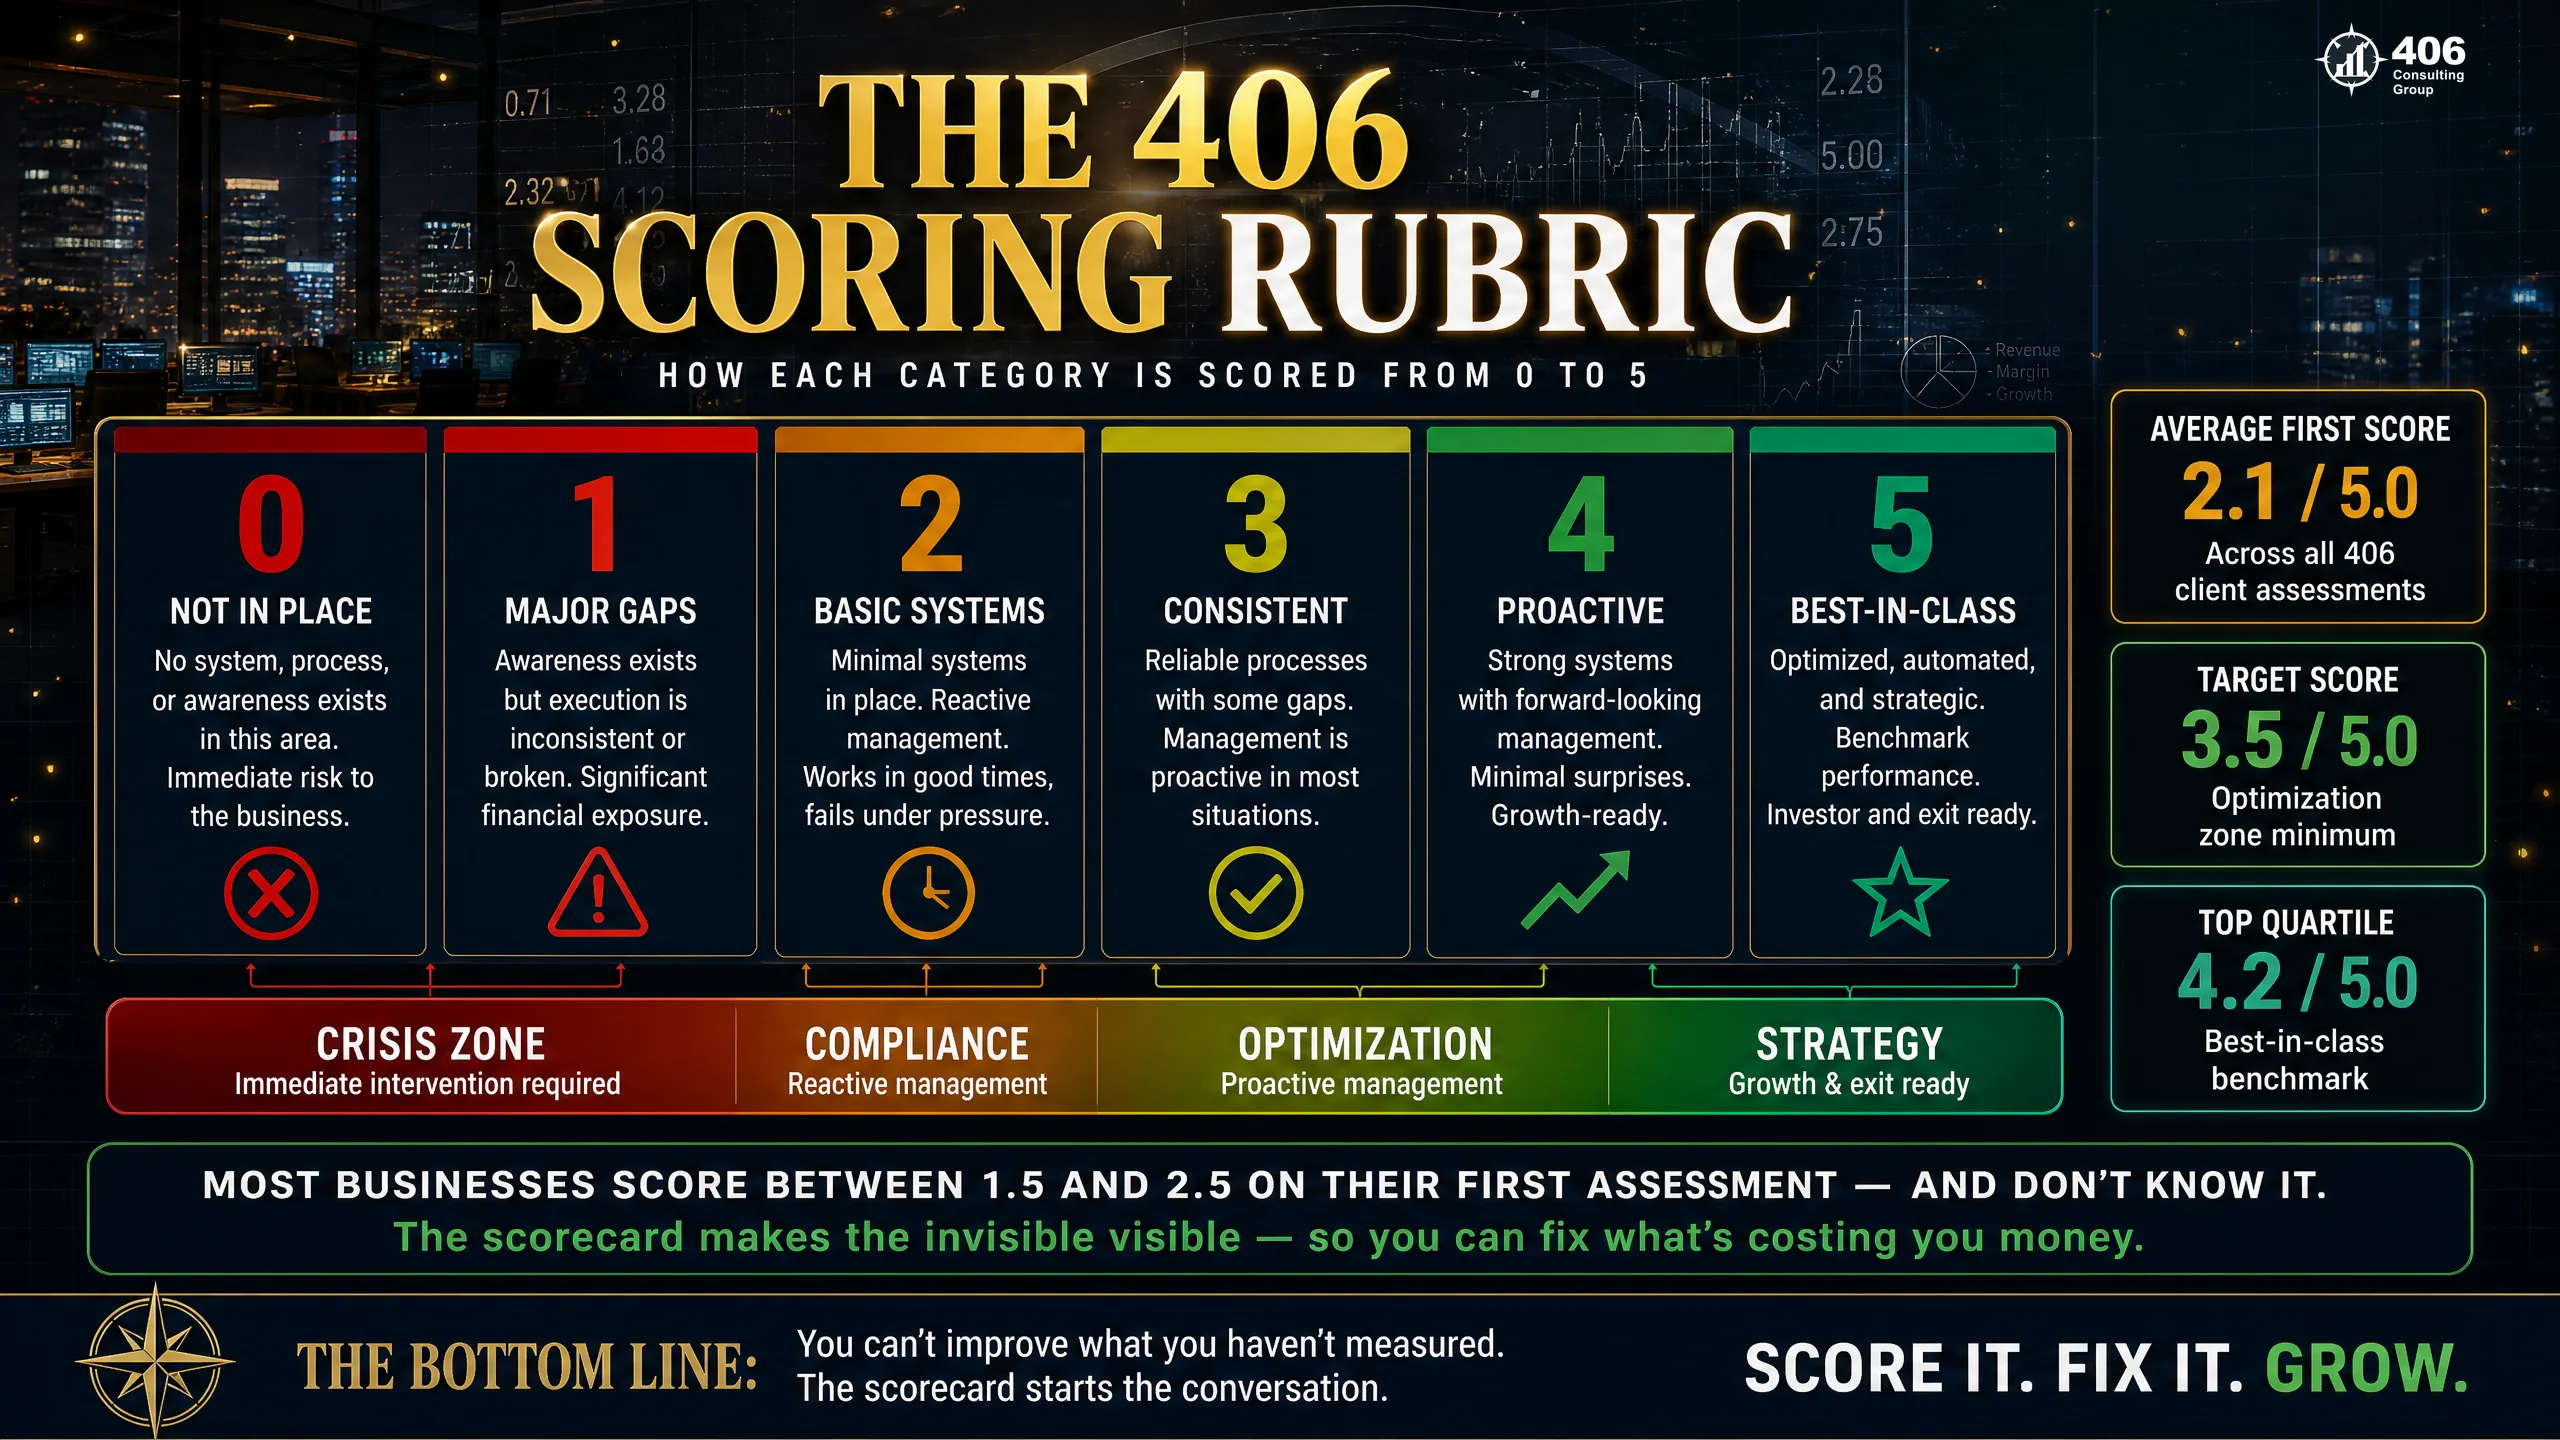
Each of the 84 assessment points is scored on a 0–5 scale. The scale isn't arbitrary — it maps to observable, specific criteria for each category. A 2 doesn't mean “pretty good.” It means the system exists but is reactive and inconsistently applied. A 4 doesn't mean “excellent.” It means data is actively driving decisions on a regular basis.
| Score | Level | What It Means in Practice | Typical Indicator |
|---|---|---|---|
| 0 | Not in Place | The system, process, or function does not exist. | No records, no process, no visibility |
| 1 | Major Gaps | Something exists but is materially incomplete, inaccurate, or ignored. | Done inconsistently; major errors common |
| 2 | Basic Systems | Functional but reactive — data exists, decisions don't consistently follow from it. | Month-end reports exist; not used for decisions |
| 3 | Consistent | Reliable systems, correctly applied, but still responding to problems rather than preventing them. | Books close on time; no forward-looking analysis |
| 4 | Proactive | Data-driven, forward-looking, actively used in decisions on a regular cadence. | Weekly KPI review; 90-day cash flow forecast maintained |
| 5 | Best-in-Class | This function creates a competitive advantage — it outperforms industry peers and supports strategic decisions. | Lender-grade reporting; real-time operational visibility |
What Most Business Owners Discover
When we complete the 84-point assessment, most business owners in the $1.5M–$5M range land between 1.8 and 2.8 on average. The score surprises them — because they knew some areas were weak, but assumed others were stronger than they were. The assessment makes the gap visible in a way that gut feel never could.
The Four Financial Maturity Bands
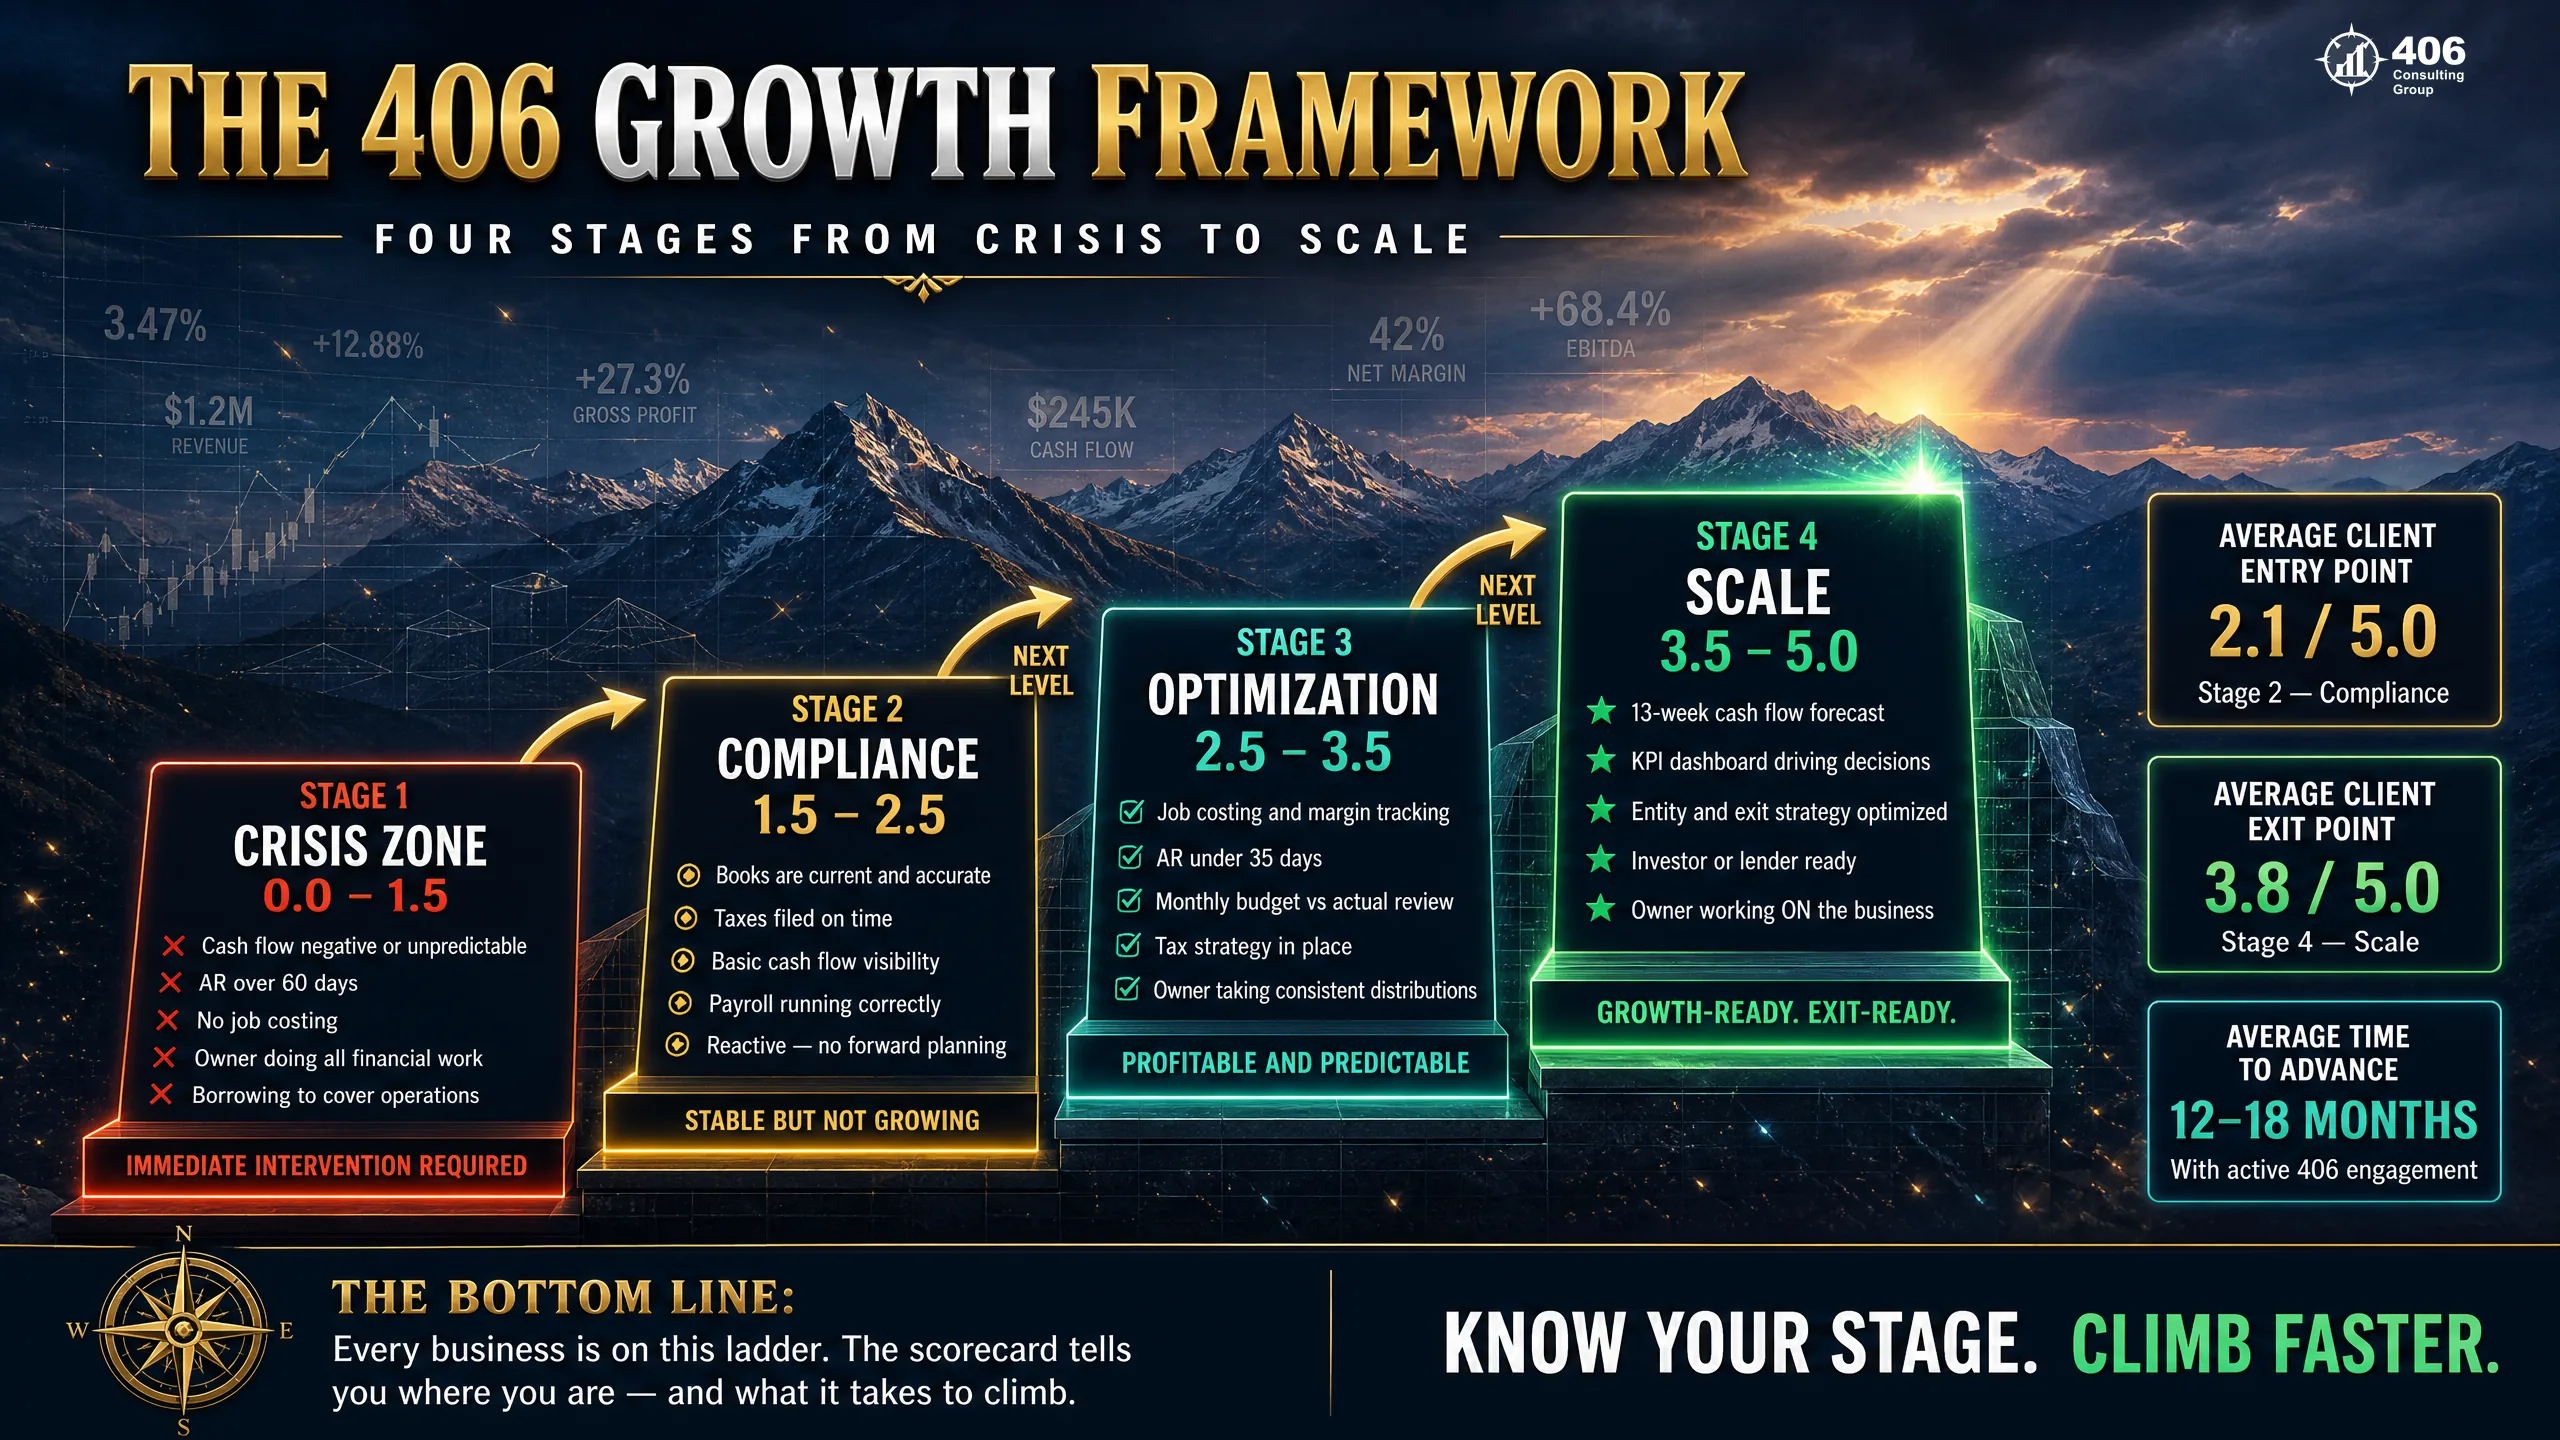
Your overall average score places your business in one of four Financial Maturity Bands. The band tells you what's possible — not as a judgment, but as a practical ceiling. Strategy layered on top of a Crisis Zone business doesn't work. Infrastructure is required first.
Crisis Zone
Average Score: Below 2.0
Immediate interventions required. One or more categories are failing in ways that create immediate financial risk. Growth at this level accelerates the existing problems rather than solving them. The priority is stabilization, not strategy.
Compliance Level
Average Score: 2.0 – 3.0
Systems exist but are reactive. Books close, reports are produced, taxes are filed — but nothing is forward-looking. Lender-ready in some areas, but not optimized. Most businesses in this band have not built the analytical layer that turns data into decisions.
Optimization Level
Average Score: 3.0 – 4.0
Infrastructure is working. The business can make data-driven decisions. Strategic initiatives are now possible and executable. This is where most CFO-level advisory creates the most impact — the foundation is there, and strategy can be built on top of it.
Strategy Level
Average Score: 4.0 – 5.0
Financial infrastructure creates a competitive advantage. The business is scalable, lender-ready, and exit-optimized. Most businesses in this band are actively growing through acquisition, preparing for a capital raise, or positioned for a sale at a premium multiple.
The 14 Categories of Financial Health
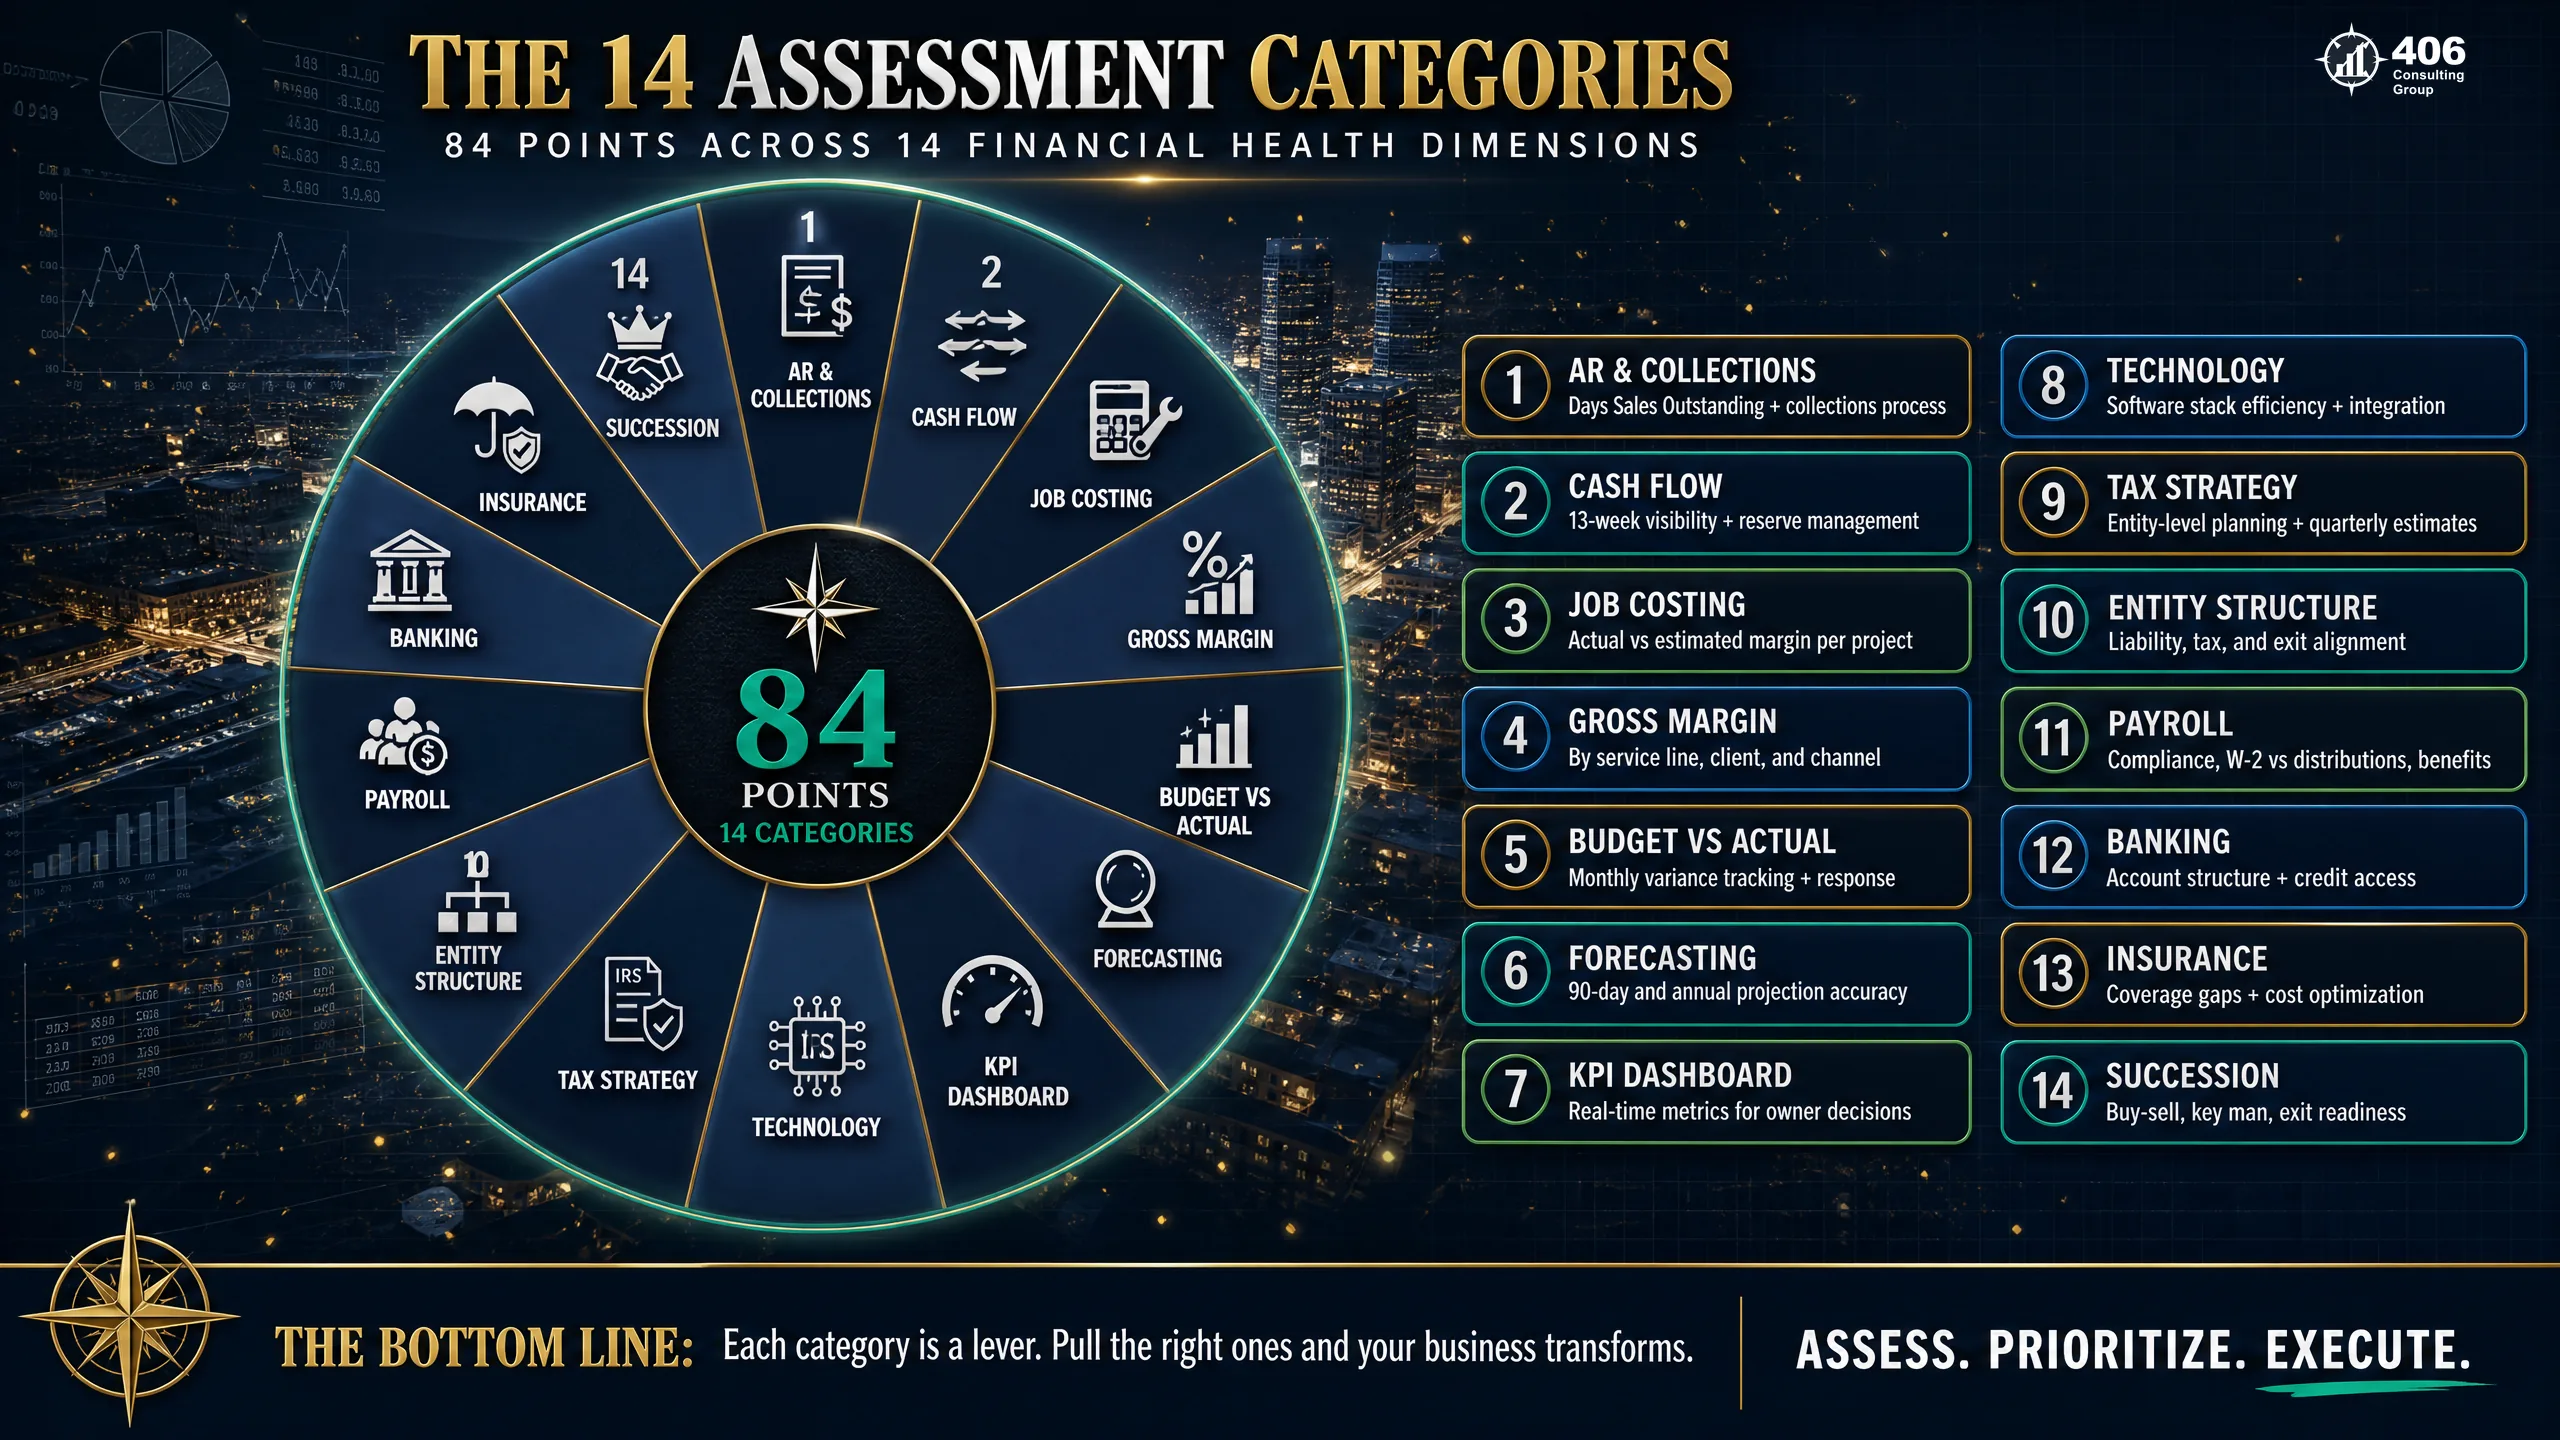
The 84-point assessment covers 14 distinct categories. Each one asks a specific question about your business. The categories are not equal in impact — some drive more dollar variance than others — but all 14 matter, because the weakest one shapes what's possible.
Accounting & Bookkeeping Infrastructure
“Are your books accurate, timely, and reliable enough to make decisions from?”
Foundation for everything else. All other categories depend on this being at least a 3.
Cash Flow Management
“Do you know where cash will be in 30, 60, and 90 days — or do you find out when the account runs low?”
The most common reason profitable businesses fail. Revenue and cash are not the same thing.
Accounts Receivable & Collections
“How long does it take to turn revenue into cash, and how much gets stuck?”
Every 10-day reduction in DSO on $2M AR frees $55K in available cash. Most businesses leave this unmanaged.
Accounts Payable & Vendor Management
“Are you paying the right people at the right time, capturing discounts, and maintaining vendor relationships?”
Poorly managed AP destroys vendor relationships and misses early-pay discounts that can total 2–3% of purchases.
Gross Margin & Job Costing
“Do you know which jobs, products, or clients actually make money — or are you averaging across all of them?”
Highest-impact category for construction, trucking, and trades. A 3% margin bleed at $3M = $90K/year invisible.
Budgeting & Forecasting
“Does your business have a financial plan — or just a hope?”
Without a budget, there is no variance analysis. Without variance analysis, you never know if the plan is working.
Key Performance Indicators
“Which 5–7 numbers drive your business, and are you watching them weekly?”
KPIs are the early warning system. Without them, you find out about problems in the financials — weeks after they happened.
Internal Controls & Fraud Prevention
“Could someone steal from you right now — and would you know within 30 days?”
ACFE: median small business fraud loss is $150K per incident. Most are discovered 18 months in.
Tax Strategy & Compliance
“Are you structured to minimize tax legally, or just paying what you owe without questioning it?”
Most businesses above $100K net profit overpay SE tax by $8,000–$20,000 per year through wrong entity structure alone.
Debt & Capital Structure
“Is your debt working for you — positioned for growth — or is the structure working against you?”
Carrie Anderson has analyzed 300+ commercial loans. Most businesses she sees are in the wrong loan structure or under-leveraged.
Payroll & HR Finance
“Are labor costs tracked accurately enough to know when you are overstaffed or understaffed?”
Labor is usually 30–50% of revenue. Managing it on a spreadsheet at $3M is like flying blind at altitude.
Inventory & Asset Management
“Do you know what your assets are worth and how hard each one is working?”
Jason identified $75M in unbilled inventory at BP using the same discipline this category measures. Untracked assets are invisible losses.
Technology & Automation Stack
“How much of your admin time is manual work that software could handle?”
A business at $3M doing manual data entry between three systems spends $30K–$60K per year on avoidable admin labor.
Exit Readiness & Valuation
“If someone offered to buy your business today, what would it be worth — and why?”
Clean books, documented systems, and reduced owner dependency are the three variables that move valuation multiples.
Deep Dive: The Four Categories That Move the Needle Most
Not all 14 categories carry equal dollar weight for most Montana businesses. Four consistently produce the most measurable impact. Here is what a score of 1 vs. 4 looks like in each one, and what the gap costs.
Category 03
Accounts Receivable & Collections
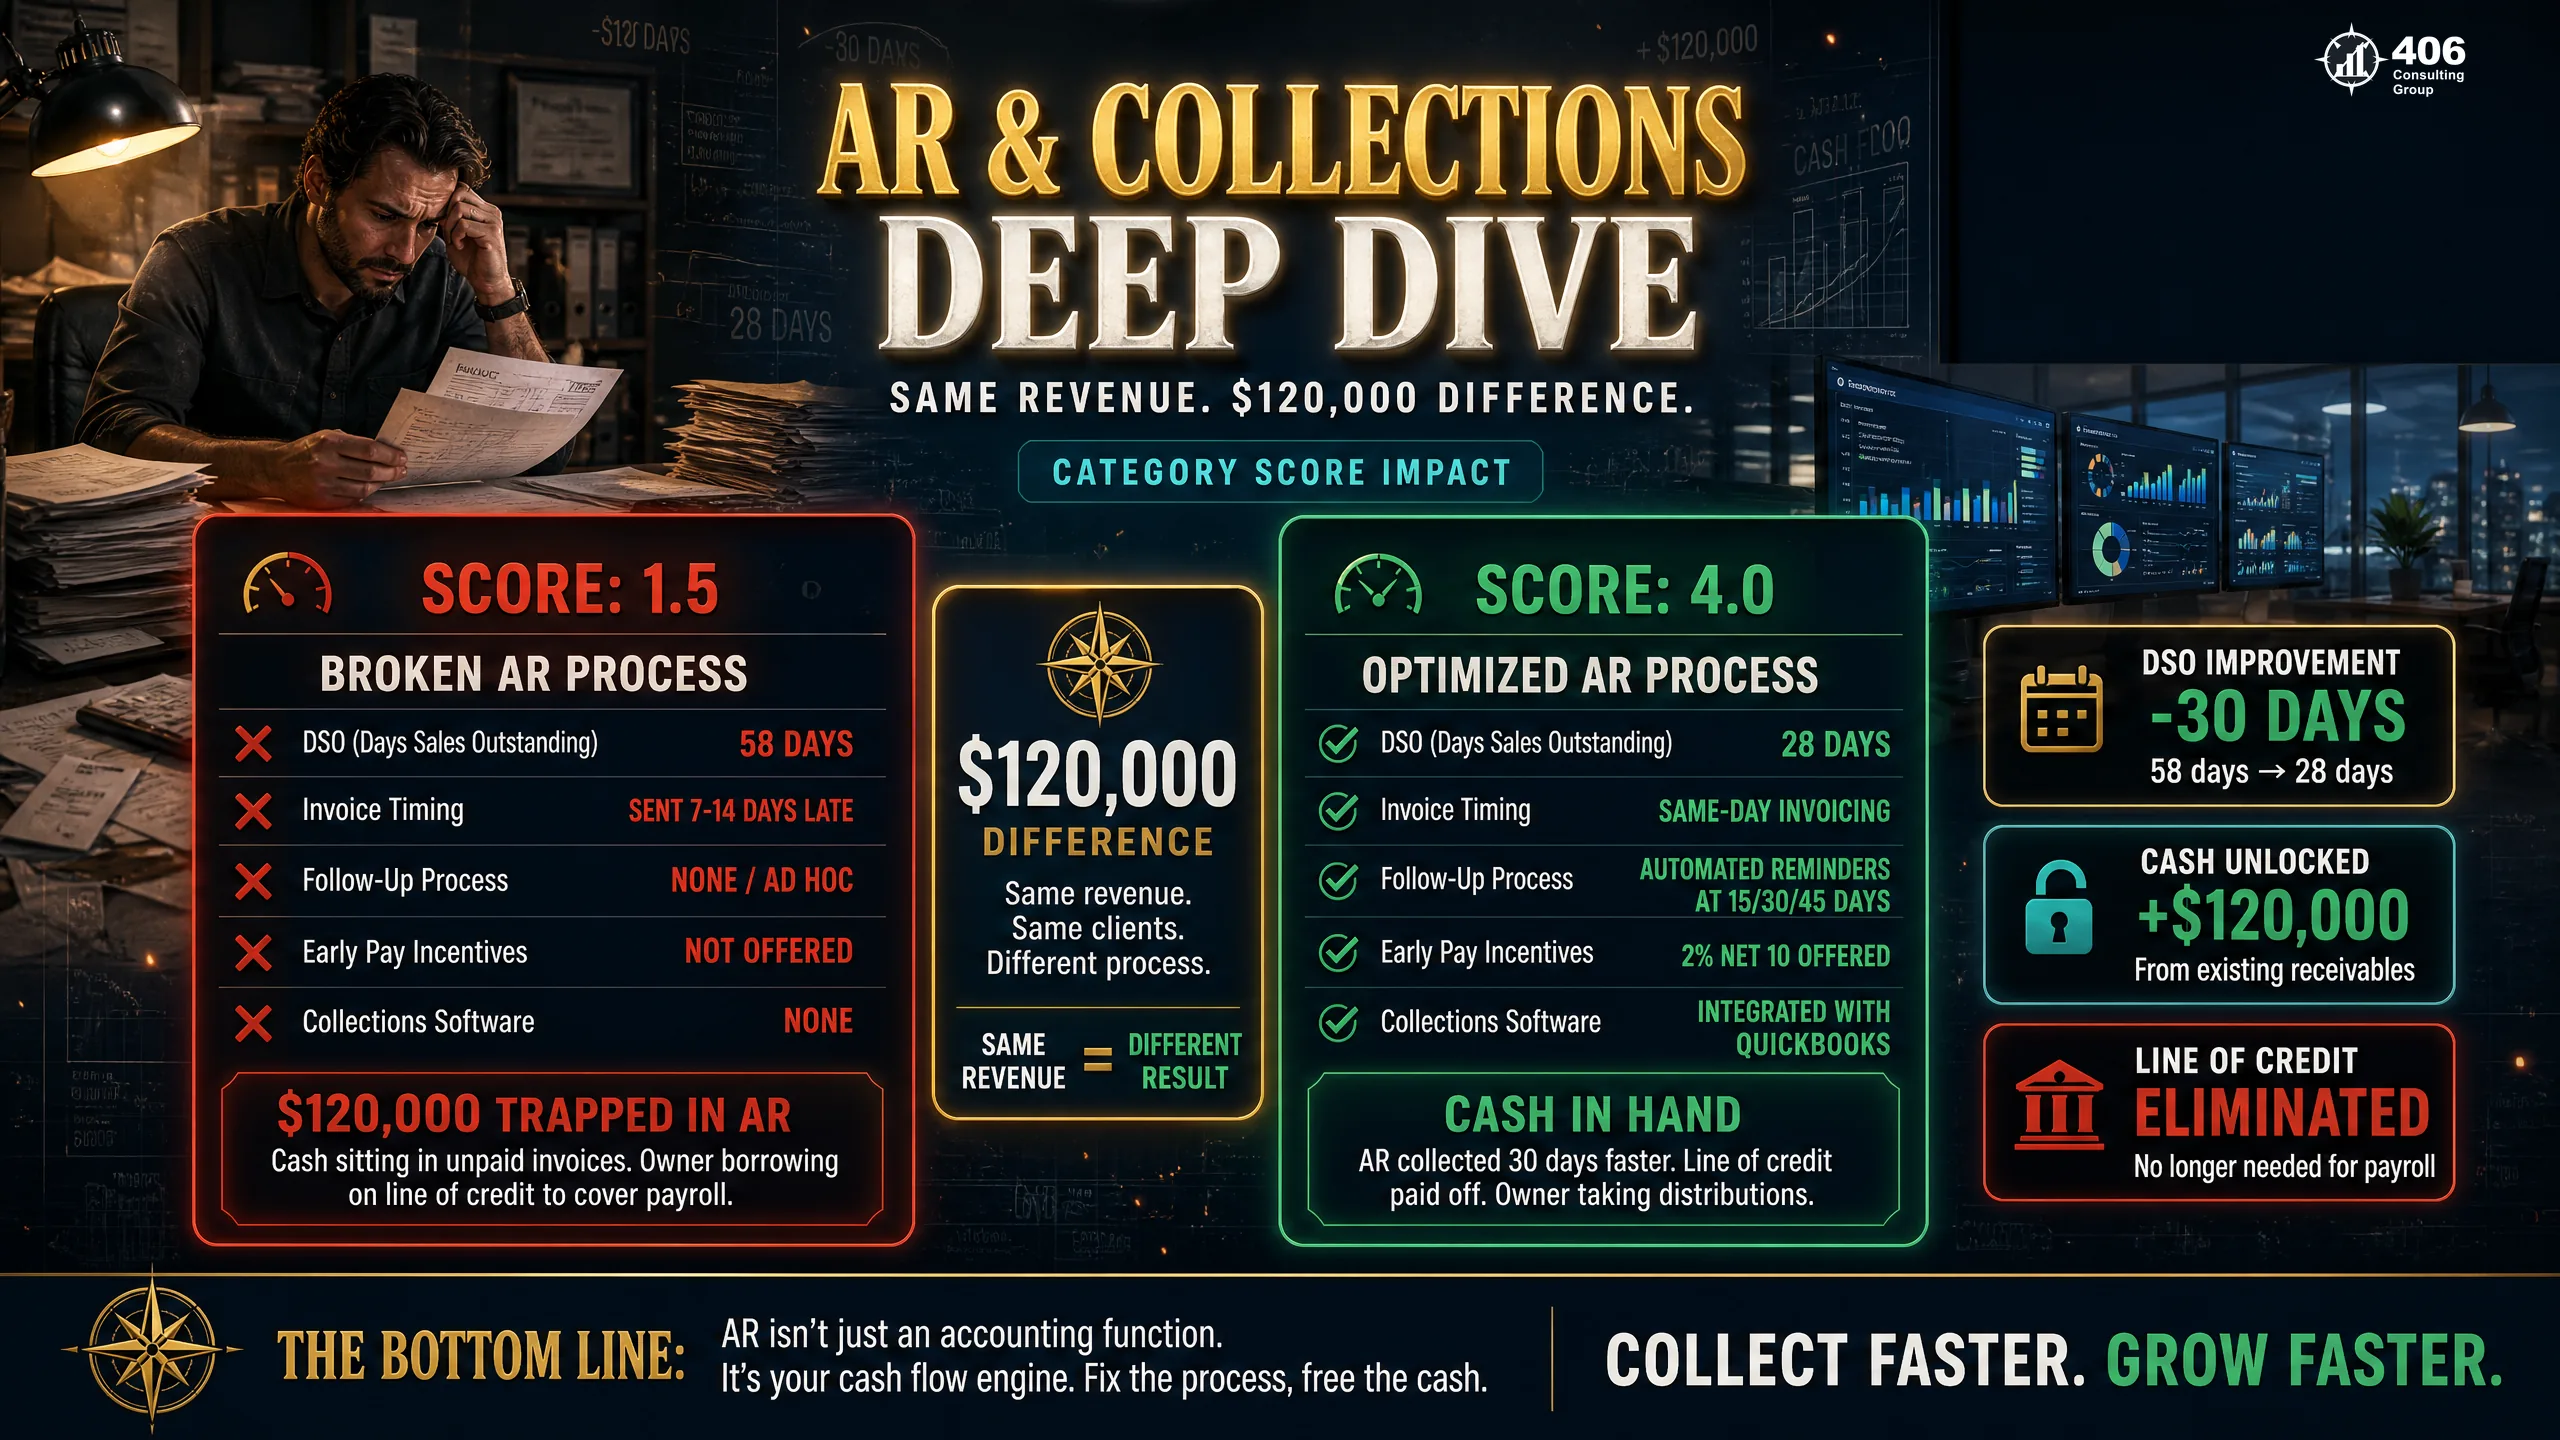
| Dimension | Score 1.0–1.5 | Score 4.0–4.5 |
|---|---|---|
| Invoice timing | Invoices sent days or weeks after job completion | Same-day or next-day invoicing, automated from job management software |
| Follow-up process | Informal — owner or admin remembers to follow up eventually | Automated reminders at day 7, 14, 30; escalation protocol at day 45 |
| Days Sales Outstanding | 58–75 days DSO | 22–32 days DSO |
| Aging review | Monthly or never — no proactive follow-up on overdue accounts | Weekly AR aging reviewed; accounts over 45 days in active collection |
| Cash impact on $2M AR | $319K–$411K trapped in receivables at all times | $121K–$175K in receivables — $165K+ difference in available cash |
Category 05
Gross Margin & Job Costing
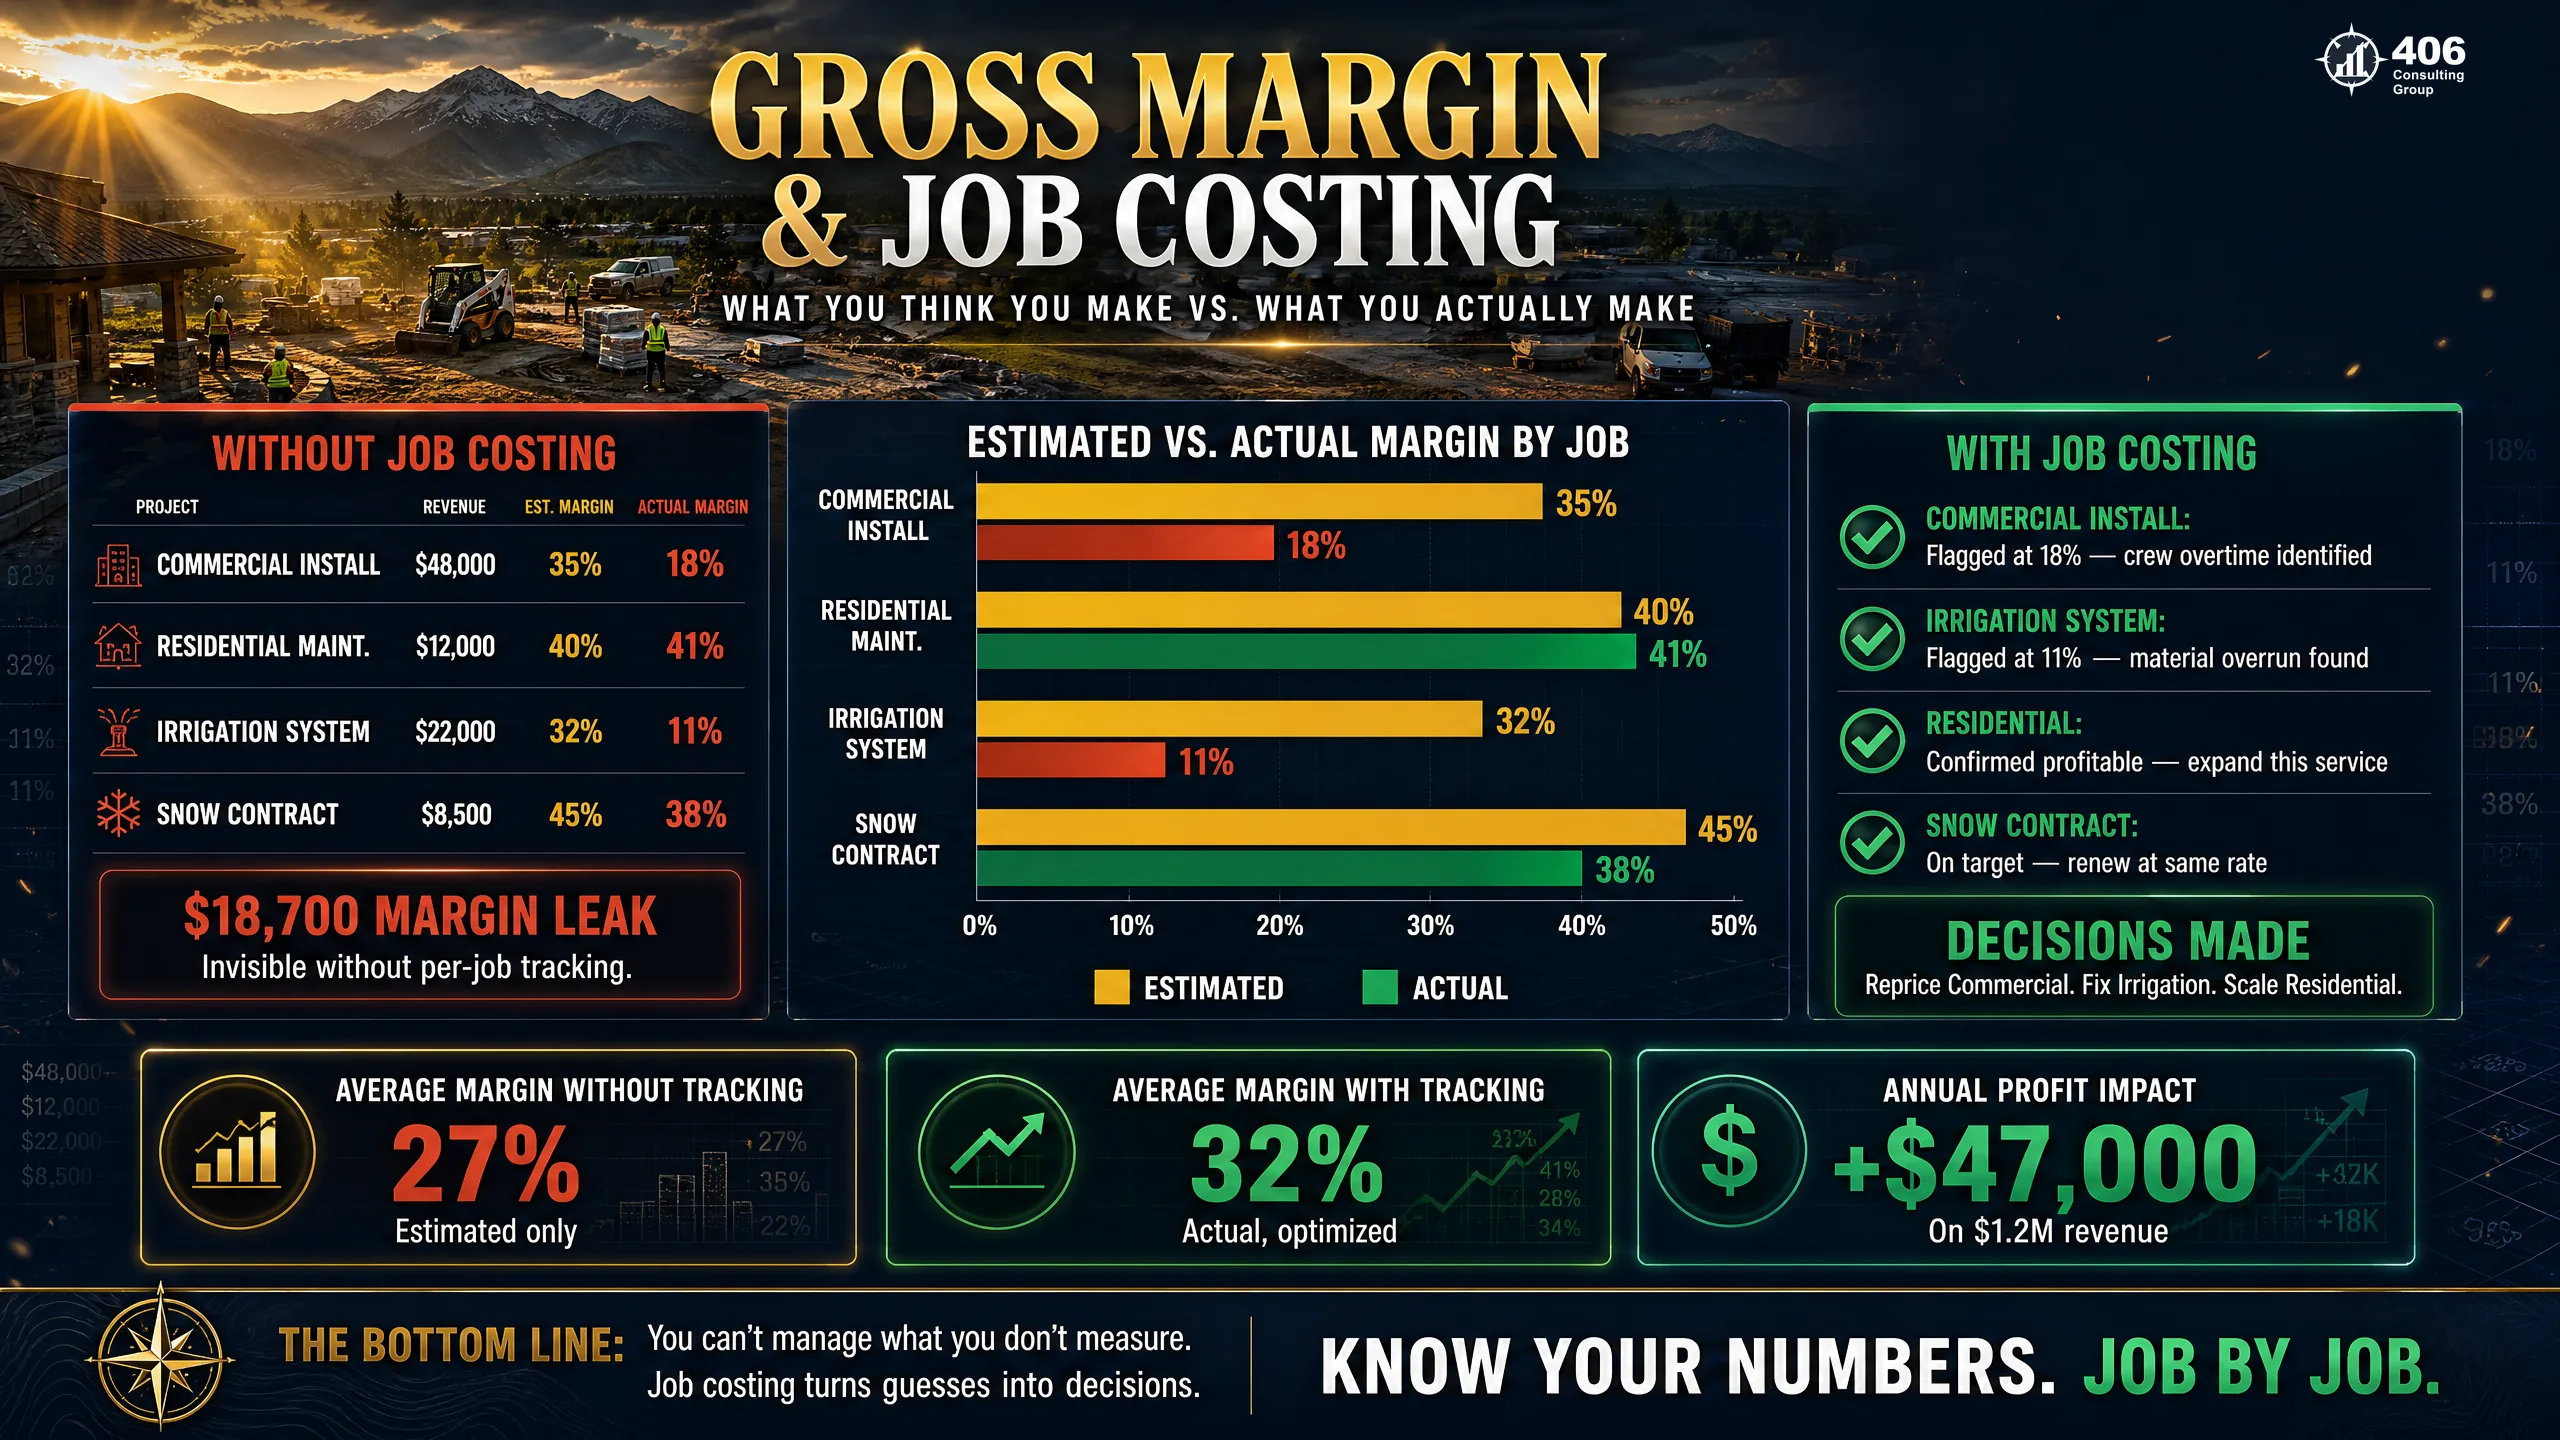
This is the highest-impact category for construction, trucking, landscaping, and any business that prices project work. Without job costing, you are averaging margin across all work — which means your profitable jobs are subsidizing the unprofitable ones without your knowledge. A 406 client in the Flathead Valley discovered their largest contract type was generating 4% gross margin when they believed it was 18%. The contract type accounted for 35% of revenue. They had been winning these contracts aggressively for two years.
1.0
No job costing
Margin is averaged across all work. No visibility into which contracts are profitable.
You are guessing on every bid.
2.5
Basic job costing
Job-level data exists but not consistently used in pricing decisions.
You have the data. You are not using it.
4.5
CFO-level job costing
Real-time cost capture, variance reporting, pricing informed by actual job margin.
Every bid is data-driven. Margin is protected.
Category 02
Cash Flow Management
Profitable businesses fail because of cash flow. Revenue is an income statement item. Cash is what pays your people on Friday. A 13-week rolling cash flow forecast, maintained weekly, changes the way a business owner operates. Instead of reacting to a low balance, they see the problem 60 days out — and have time to solve it before it becomes a crisis.
Score 1.5 vs. Score 4.0 in Cash Flow Management:
Score 1.5 — Reactive
- ✗Decisions made by checking bank balance
- ✗Payroll stress every other Friday
- ✗Line of credit used to fill gaps, not for growth
- ✗Capital purchases made impulsively
- ✗Loan applications scrambled when crisis hits
Score 4.0 — Proactive
- ✓13-week rolling forecast updated weekly
- ✓Payroll funded two weeks in advance
- ✓Line of credit used strategically for growth capital
- ✓Capital purchases planned and modeled in advance
- ✓Lender relationships maintained proactively
Category 13
Technology & Automation Stack
Most businesses underestimate what manual work actually costs. At $3M in revenue, a business with unintegrated systems and manual data-entry processes typically spends $30,000–$60,000 per year on avoidable admin labor. That's the cost of three systems that don't talk to each other, one person re-entering the same data twice a day, and reports that take four hours to produce instead of four minutes. The fix is rarely expensive — typically $2,000–$4,000 per year in software — and the ROI is measured in months.
What a Technology Score of 1.0 Looks Like
QuickBooks Desktop not synced to anything. Invoices created in Word. Job tracking in a spreadsheet updated manually. Payroll run by calling in hours every two weeks from a handwritten timesheet. Reports take a half-day to produce. Data exists in three places and is reconciled by memory. This profile is not uncommon in Flathead Valley businesses at $2M–$3M in revenue — and it costs the business $40,000–$70,000 per year in avoidable admin labor.
What an Imbalanced Score Profile Looks Like in Practice
The most dangerous business is not the one that's weak across the board — that owner knows they have work to do. The most dangerous business is the one that's strong in one or two categories and assumes the whole picture is better than it is. Here are three patterns we see repeatedly.
Profile A: Strong Books, Chronic Cash Shortage
4.5
Accounting Infrastructure
1.5
AR & Collections
1.8
Cash Flow Management
Clean books do not solve a collections problem. This profile — common in professional services and construction — has accurate historical data and a cash flow crisis every other month. The books confirm the revenue is real. The AR process means it takes 65 days to collect it. A profitable month on paper still means a payroll scramble on Friday.
Profile B: Growing Revenue, Shrinking Profit
1.2
Gross Margin / Job Costing
1.0
Budgeting & Forecasting
Strong
Revenue Growth
Growing revenue without job costing is driving faster with your eyes closed. This profile wins more work, hires more people, buys more equipment — and wonders why the bank account never reflects the revenue. The answer is usually four to six contract types losing money, discovered only when job costing is introduced.
Profile C: Drowning in Admin, Starved of Margin
1.0
Technology & Automation
1.5
Internal Controls
1.8
Payroll & HR Finance
This profile has five people doing work that two people and integrated software could handle. The business is not understaffed — it is under-automated. Every process is manual, every report takes hours, and nobody has time to work on the business because everyone is working in it. The fix typically involves $3K–$5K in annual software costs and saves $40K–$70K in admin labor.
Real Numbers: The Valley Green Scapes Case Study
Valley Green Scapes is a $4.2M landscaping company in Montana's Flathead Valley. When they came to 406, the owner believed the business was doing reasonably well. Revenue was growing. The crew was busy. But the owner couldn't explain why cash was always tight — and couldn't point to a specific problem. The Scorecard assessment told the story.
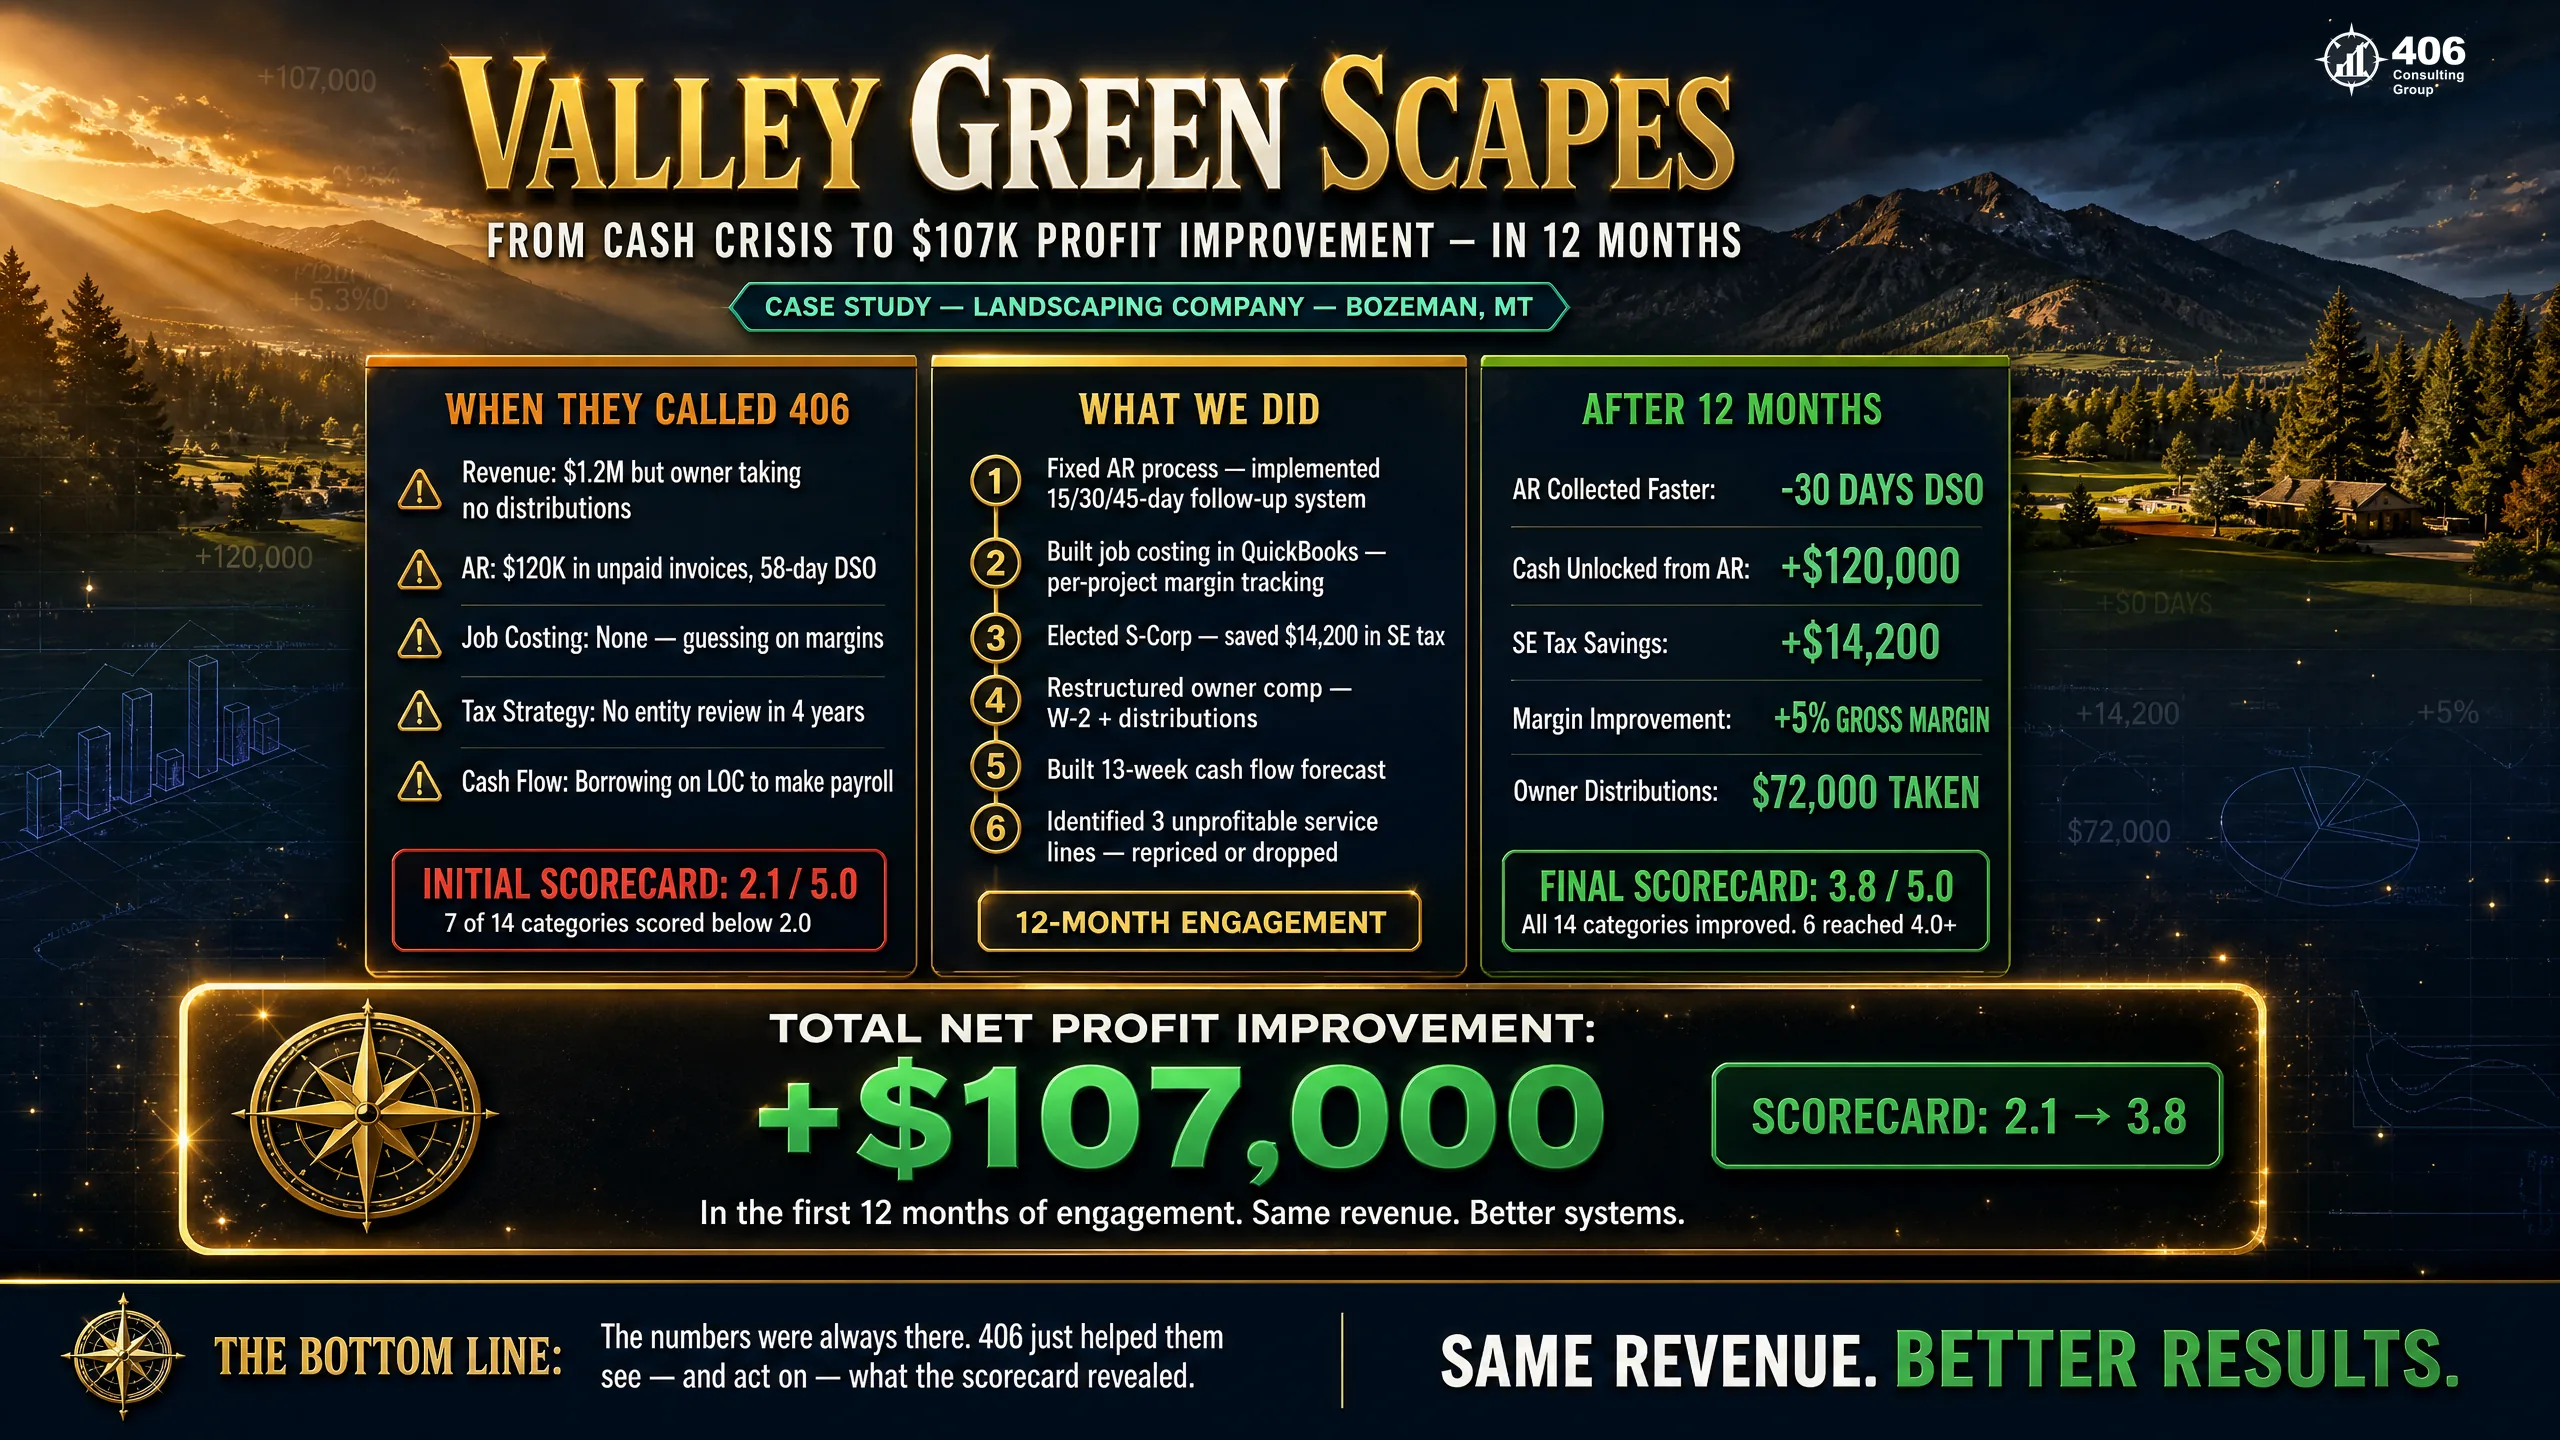
| Category | Score | What Was Found | Annual Cost |
|---|---|---|---|
| Accounts Receivable & Collections | 1.5 | DSO at 58 days. No formal follow-up process. Invoices sent 5–7 days after job completion. | $120,000 trapped |
| Gross Margin & Job Costing | 2.0 | No job-level costing. Residential and commercial contracts priced identically despite different cost structures. | $85,000 underearned |
| Technology & Automation Stack | 1.0 | Three disconnected systems. One admin manually re-entering job data daily. Scheduling done on paper. | $22,000 avoidable admin |
| Overall Average Score | 1.8 | Business in Compliance Level — systems exist but reactive across most categories. | $227,000 total leaks |
Before
1.8
Overall Average Score
• Cash flow unpredictable month to month
• Owner unsure which contracts were profitable
• $227,000 in measurable financial leaks
• Growing revenue, shrinking confidence
After 6 Months
3.6
Overall Average Score
• DSO reduced to 29 days — automated collections
• Job costing introduced across all contract types
• Admin platform integrated — manual entry eliminated
• +$107,000 net profit impact
What Made the Difference
This was not a complete overhaul. Three categories — AR, Job Costing, and Technology — were prioritized based on dollar impact and sequencing. AR first, because recovering cash was the fastest win. Job costing second, because pricing decisions needed data. Technology third, because automation supported the first two without adding headcount. The $107K net profit improvement came from three focused fixes in six months — not a 90-day transformation across all 14 categories simultaneously.
How 406 Conducts the Assessment
The 84-point assessment is not a checklist emailed to the client. It is a structured, two-week process conducted by Jason and Carrie Anderson directly — not delegated to a junior associate. Here is what that process looks like.
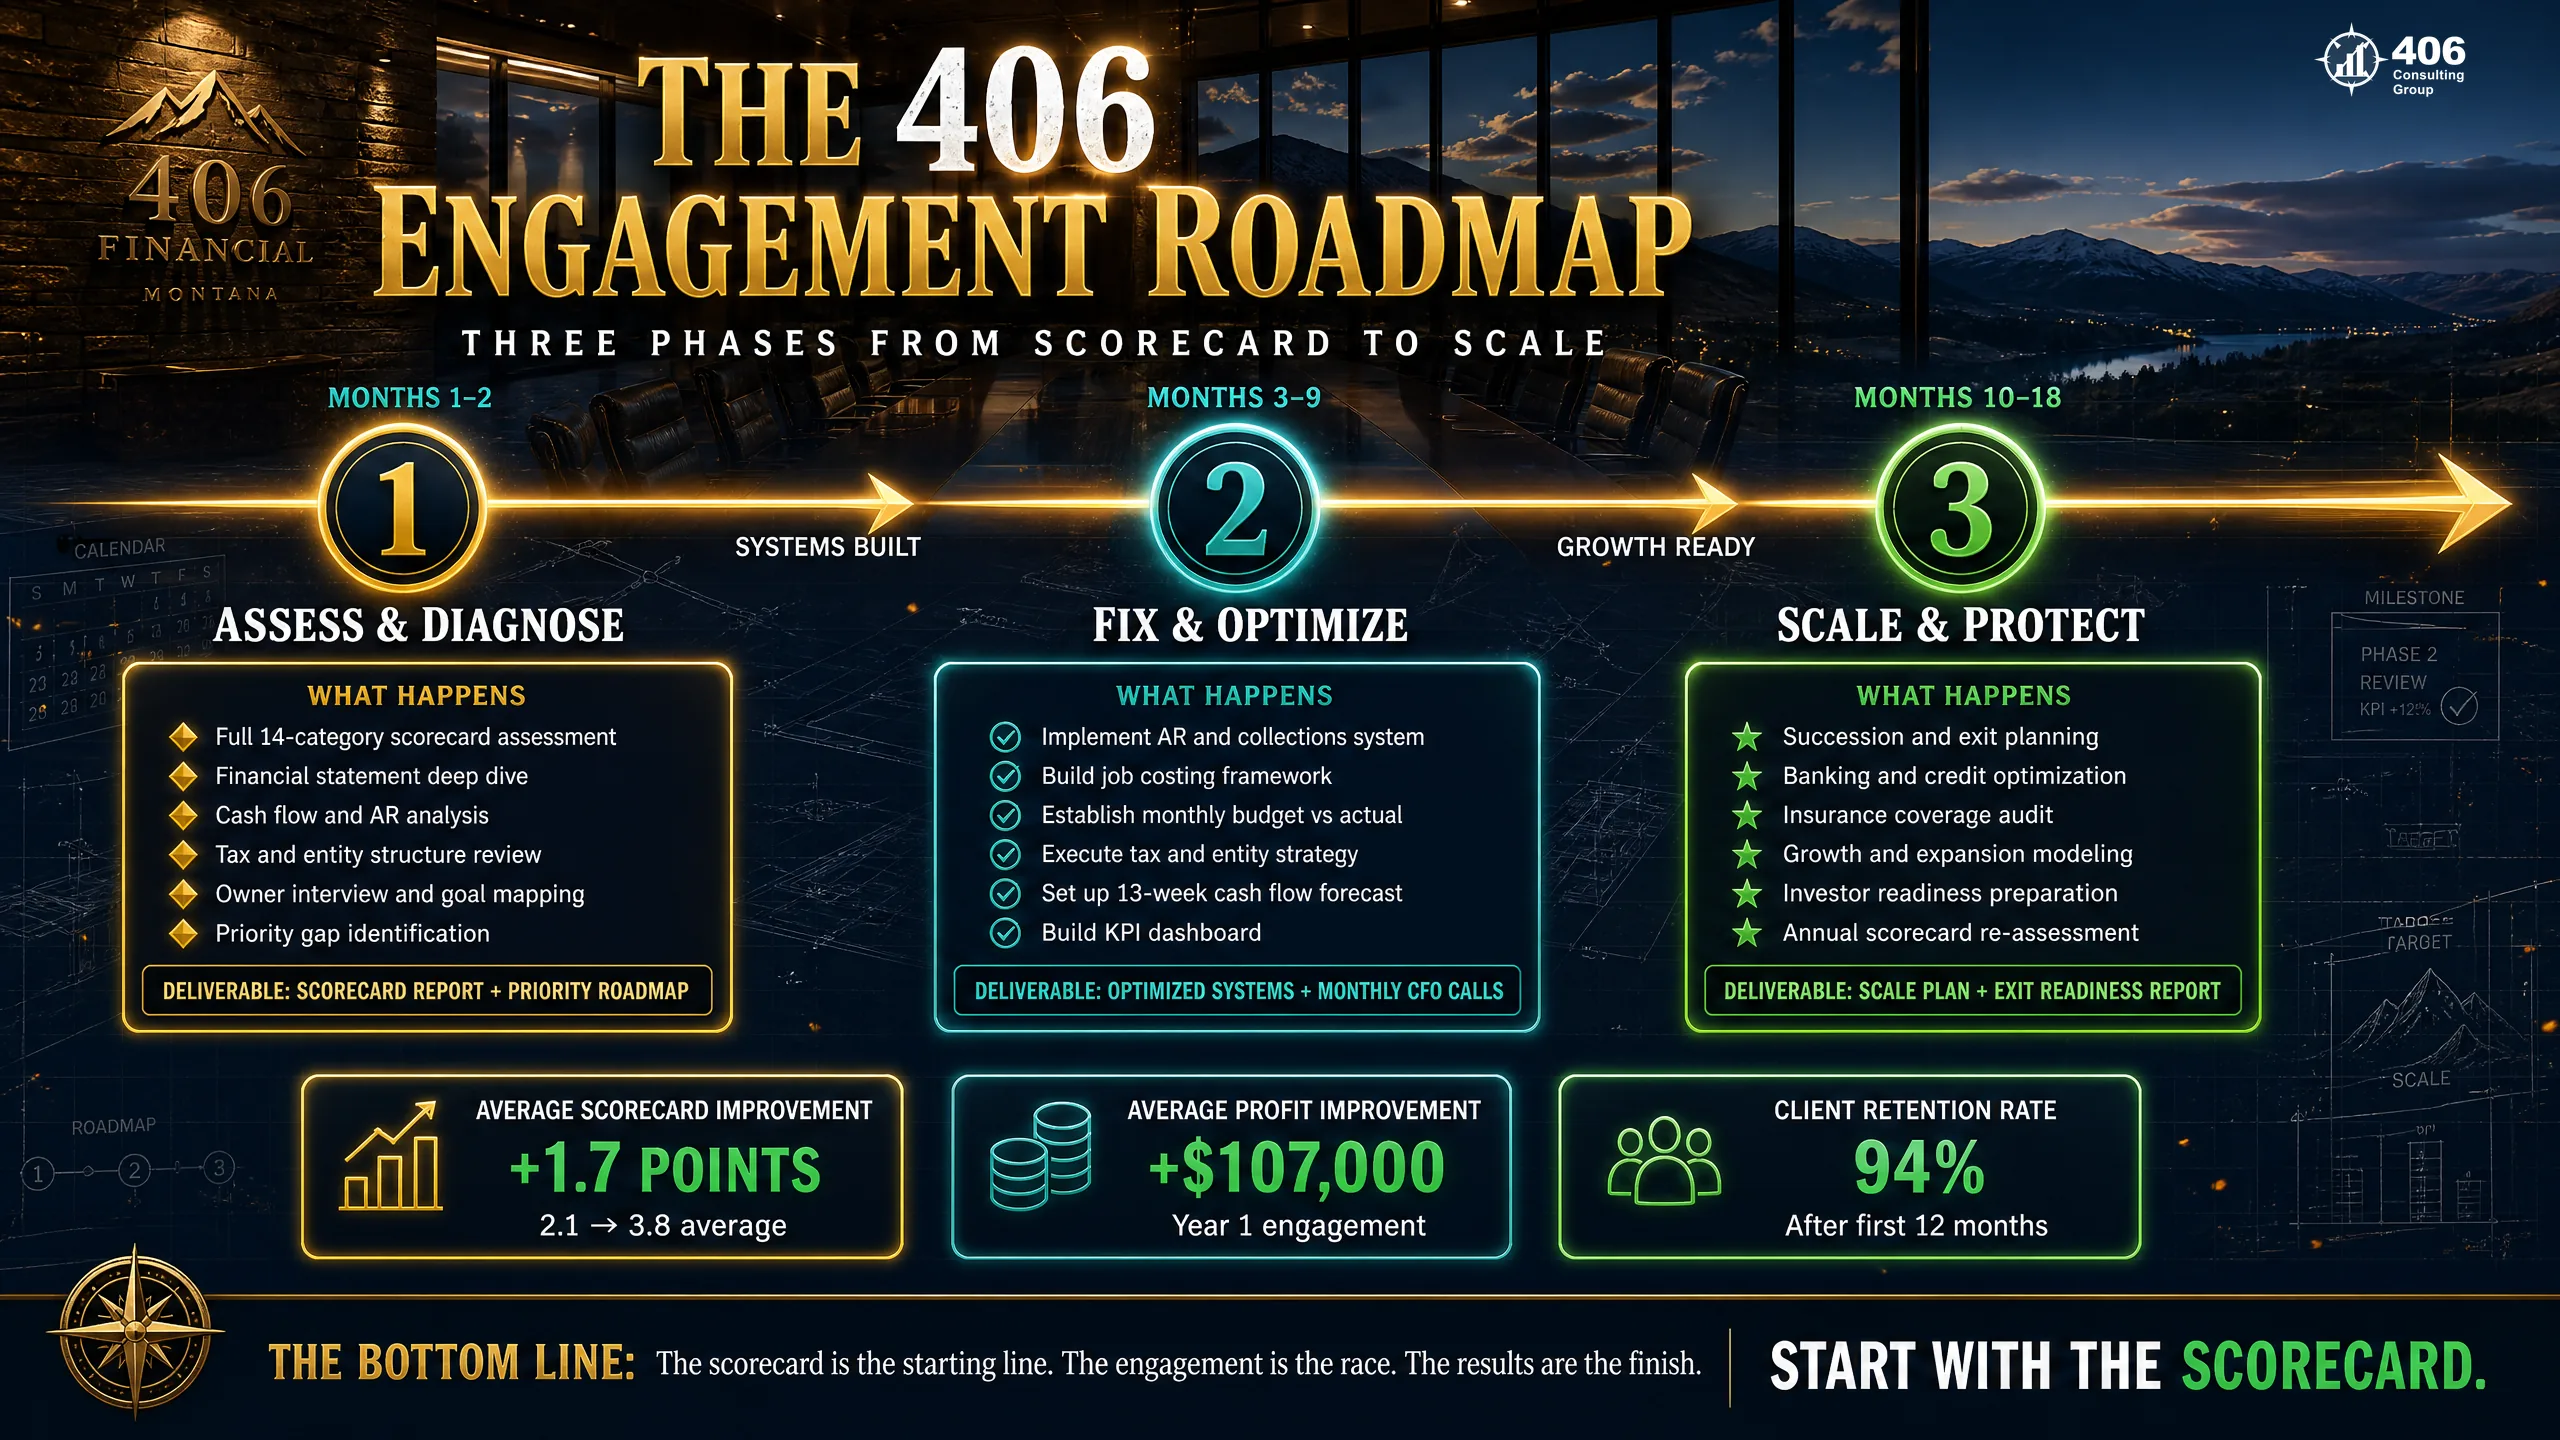
Why This Is Different from Hiring a Fractional CFO Who Gives You a Playbook
Fractional CFO services have become widely available. The quality varies enormously. The most common failure mode is not incompetence — it is sequencing. Strategy layered on top of weak reporting, inconsistent books, or missing financial infrastructure produces advice that does not take hold. The foundation was not there to support it.
Typical CPA Firm
Typical Fractional CFO
406 Consulting Group
The G.R.O.W.T.H. framework governs how every 406 engagement runs. Grounded in your actual numbers, not generic benchmarks. Real-time visibility, not month-old reports. Ownership-ready financials, built to support a sale or capital raise. Work built from operational experience before AI existed. Transparent pricing — no surprise invoices. Held accountable to results — with the Scorecard as the measuring stick.
$8M → $40M
Construction company growth
Multi-year CFO engagement. Job costing, cash flow forecasting, and reporting architecture built first — scaling came after infrastructure was in place.
45 Days
Trucking company stabilized
45 days from closing when Carrie identified the cash flow gaps and restructured the reporting. It's still operating today.
$7M SBA
Loan after bank rejection
Auto body group, five locations. Prior CPA's forecasts failed underwriting. Carrie rebuilt the books and delivered SBA-standard projections. Loan closed.
25+ Years
A system still in use
Jason built an inventory reconciliation system at BP. Accenture was brought in to replicate it as a web application. It has been in production for more than 25 years.
The Foundation Principle
406 Consulting Group was built on one principle: assess where you are, build what's missing, then drive strategy on top of infrastructure that actually holds. Every engagement starts with understanding the gaps — not with a service menu. The Scorecard is not a product. It's the first step in every engagement, because it's the only way to know what to recommend. Learn more at Why We're Different and About Us.
The Controller Service: What It Covers and Who Needs It
Many Montana businesses are past bookkeeping — but not yet at fractional CFO complexity. Revenue is between $1.5M and $5M. The books close each month. But nobody owns the financial function at the management level: reviewing the close for accuracy, building the reporting package that tells the real story, managing internal controls, and maintaining the lender relationship before it matters.
That gap is the controller function. At 406, controller services are not defined by a title — they are defined by what your business actually needs. The Scorecard tells us whether you need a controller, a fractional CFO, or both — and in what sequence. Here is what controller-level work covers:
Monthly Close Ownership
Not just recording transactions — the review, adjustment, and sign-off layer that ensures your financials are accurate before they leave accounting. Most bookkeepers record. A controller verifies.
Financial Reporting Package
Monthly reporting built for decisions, not just for the tax return. P&L by category, cash position, AR aging, budget-to-actual variance, and KPI snapshot — delivered by the 15th.
Internal Controls Design
Authorization hierarchies, segregation of duties, reconciliation schedules, and expense review protocols. Designed to prevent the fraud that costs small businesses an average of $150,000 per incident.
Lender-Ready Financials
Maintained month by month — not scrambled together when you need a loan. Carrie has packaged 300+ commercial loans. She knows exactly what a lender needs and how the financials should be presented.
KPI Dashboard Ownership
The 5–7 numbers that drive your business, tracked and reported on a weekly or monthly cadence — the metrics that predict problems before the P&L confirms them.
Bank & Vendor Relationship Management
Proactive communication with lenders, coordinated AP management, and covenant compliance monitoring. Most businesses wait for the bank to call. A controller calls first.
How the Scorecard Determines What You Need
Below 2.5
Controller First
Infrastructure before strategy. Build clean books, reporting, and controls before CFO-level advisory adds value.
2.5 – 3.5
Controller + Fractional CFO
Foundation exists, strategy is now executable. Controller owns the data; CFO drives decisions on top of it.
Above 3.5
Fractional CFO Advisory
Infrastructure is working. Strategy, forecasting, capital structure, and exit planning are the high-value work.
Your 10-Question Self-Diagnostic
Before the 84-point assessment, here are ten questions that give you a directional read on where you stand. Score yourself honestly on a 1–5 scale for each. If you score below 3.0 on four or more, the full Scorecard will tell you exactly where to focus first.
My books are reconciled and the month-end close is complete by the 15th of every month.
I know my gross margin by job type, product line, or client — not just in aggregate.
I know exactly how much cash my business will have in 60 days.
My AR aging report is reviewed every week, and all accounts over 45 days are in active follow-up.
My business has a written budget for the next 12 months that is reviewed monthly against actuals.
I track 5–7 specific KPIs on a weekly or bi-weekly basis.
My business could survive an IRS audit without requiring me to gather documents for more than one week.
I know my business's current estimated sale value within 20% — and I know what drives that number.
The software systems in my business talk to each other without manual re-entry of data.
A key financial employee could leave tomorrow and the financial function would continue without a crisis.
Below 2.0 average
Immediate action warranted
Significant gaps present. Growth accelerates the problems already in place.
2.0 – 3.0 average
Functional but not scalable
Systems exist. They are not driving decisions or protecting margin.
3.0+ average
Ready for growth or exit
Infrastructure is working. Strategy is now the high-value conversation.
Ready for the Full 84-Point Assessment?
The full Scorecard takes two weeks and produces a prioritized roadmap — the three to five things to fix first, sequenced by dollar impact and interdependency.
Take the Financial Maturity AssessmentCFO Services Scorecard
84-point assessment · 14 categories
Financial Maturity Bands
Below 2.0 — Crisis Zone
Immediate interventions required
2.0 – 3.0 — Compliance Level
Systems exist; reactive management
3.0 – 4.0 — Optimization Level
Infrastructure working; strategy possible
4.0 – 5.0 — Strategy Level
Competitive advantage; scale-ready
Start with the Assessment
Free Financial Maturity diagnostic
Services Referenced
About 406 Consulting
Jason Anderson (B.S. Accounting, 10+ years tax preparation, BP operational background) and Carrie Anderson (Corporate Controller, 300+ commercial loans analyzed, FDIC examination support) founded 406 Consulting Group on one principle: operational intelligence first, strategy second.
Why We're DifferentRead the Full Founder Story